sklearn学习之Spectral Clustering
基本思想
谱聚类是从图论中演化出来的算法,后来在聚类中得到了广泛的应用。它的主要思想是把所有的数据看做空间中的点,这些点之间可以用边连接起来。距离较远的两个点之间的边权重值较低,而距离较近的两个点之间的边权重值较高,通过对所有数据点组成的图进行切图,让切图后不同的子图间边权重和尽可能的低,而子图内的边权重和尽可能的高,从而达到聚类的目的。
谱聚类的算法流程可总结如下:
输入:样本集 D = ( x 1 , x 2 , ⋯ , x n ) D=(x_1,x_2,\cdots,x_n) D=(x1,x2,⋯,xn),相似矩阵的生成方式,降维后的维度 k 1 k_1 k1,聚类方法,聚类后的维度 k 2 k_2 k2
输出:簇划分 C ( c 1 , c 2 , ⋯ , c k 2 ) C(c_1,c_2,\cdots,c_{k_2}) C(c1,c2,⋯,ck2)
(1)根据输入的相似矩阵的生成方式构建样本的相似矩阵 S S S
(2)根据相似矩阵 S S S构建邻接矩阵 W W W,构建度矩阵 D D D
(3)计算出拉普拉斯矩阵 L L L
(4)构建标准化后的拉普拉斯矩阵 D − 1 2 L D − 1 2 D^{-\frac{1}{2}}LD^{-\frac{1}{2}} D−21LD−21
(5)计算 D − 1 2 L D − 1 2 D^{-\frac{1}{2}}LD^{-\frac{1}{2}} D−21LD−21最小的 k 1 k_1 k1个特征值所各自对应的特征向量 f f f
(6)将各自对应的特征向量 f f f组成的矩阵按行标准化,最终组成 n × k 1 n \times k_1 n×k1维的特征矩阵 F F F
(7)对 F F F中的每一行作为一个 k 1 k_1 k1维的样本,共 n n n个样本,用输入的聚类方法进行聚类,聚类维数为 k 2 k_2 k2
(8)得到簇划分 C ( c 1 , c 2 , ⋯ , c k 2 ) C(c_1,c_2,\cdots,c_{k_2}) C(c1,c2,⋯,ck2)
谱聚类的主要优点有:
(1)谱聚类只需要数据之间的相似度矩阵,因此对于处理稀疏数据的聚类很有效。传统聚类算法比如K-Means很难做到这一点
(2)由于使用了降维,因此在处理高维数据聚类时的复杂度比传统聚类算法好
谱聚类的主要缺点有:
(1)如果最终聚类的维度非常高,则由于降维的幅度不够,谱聚类的运行速度和最后的聚类效果可能都不好
(2)聚类效果依赖于相似矩阵,不同的相似矩阵得到的最终聚类效果可能很不同
API学习
sklearn.cluster.spectral_clustering(
	affinity,
	*,
	n_clusters=8,
	n_components=None,
	eigen_solver=None,
	random_state=None,
	n_init=10,
	eigen_tol=0.0,
	assign_labels='kmeans',
	verbose=False
)
| 参数 | 类型 | 解释 |
|---|---|---|
| affinity | str or callable, default=’rbf’ | 构建权重矩阵的方法,默认为径向基函数,还可选用’nearest_neighbors’/‘precomputed’/‘precomputed_nearest_neighbors’ |
| n_clusters | int, default=None | 聚类数 |
| n_components | int, default=n_clusters | 用于谱嵌入的特征向量数 |
| eigen_solver | {None, ‘arpack’, ‘lobpcg’, or ‘amg’} | 使用的特征值分解方法,None表示使用’arpack’,使用’amg’需要pyamg包 |
| random_state | int, RandomState instance, default=None | 初始化特征向量分解和K-Means聚类的随机数生成器 |
| n_init | int, default=10 | 迭代次数,当assign_labels为’kmeans’时使用 |
| eigen_tol | float, default=0.0 | 使用’arpack’时拉普拉斯矩阵特征分解的终止条件 |
| assign_labels | {‘kmeans’, ‘discretize’}, default=‘kmeans’ | 拉普拉斯嵌入后使用的分类策略,'kmeans’策略对初始化更敏感 |
| verbose | bool, default=False | 输出信息是否详细 |
代码示例
>>> from sklearn.cluster import SpectralClustering
>>> sc = SpectralClustering(3, affinity='precomputed', n_init=100,
...                         assign_labels='discretize')
>>> sc.fit_predict(adjacency_matrix)
作品学习
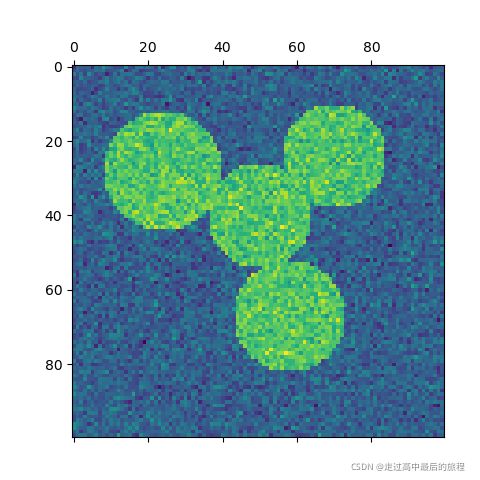
import numpy as np
import matplotlib.pyplot as plt

from sklearn.feature_extraction import image
from sklearn.cluster import spectral_clustering

l = 100
x, y = np.indices((l, l))

center1 = (28, 24)
center2 = (40, 50)
center3 = (67, 58)
center4 = (24, 70)

radius1, radius2, radius3, radius4 = 16, 14, 15, 14

circle1 = (x - center1[0]) ** 2 + (y - center1[1]) ** 2 < radius1 ** 2
circle2 = (x - center2[0]) ** 2 + (y - center2[1]) ** 2 < radius2 ** 2
circle3 = (x - center3[0]) ** 2 + (y - center3[1]) ** 2 < radius3 ** 2
circle4 = (x - center4[0]) ** 2 + (y - center4[1]) ** 2 < radius4 ** 2

# #############################################################################
# 4 circles
img = circle1 + circle2 + circle3 + circle4

# We use a mask that limits to the foreground: the problem that we are
# interested in here is not separating the objects from the background,
# but separating them one from the other.
mask = img.astype(bool)

img = img.astype(float)
img += 1 + 0.2 * np.random.randn(*img.shape)

# Convert the image into a graph with the value of the gradient on the
# edges.
graph = image.img_to_graph(img, mask=mask)

# Take a decreasing function of the gradient: we take it weakly
# dependent from the gradient the segmentation is close to a voronoi
graph.data = np.exp(-graph.data / graph.data.std())

# Force the solver to be arpack, since amg is numerically
# unstable on this example
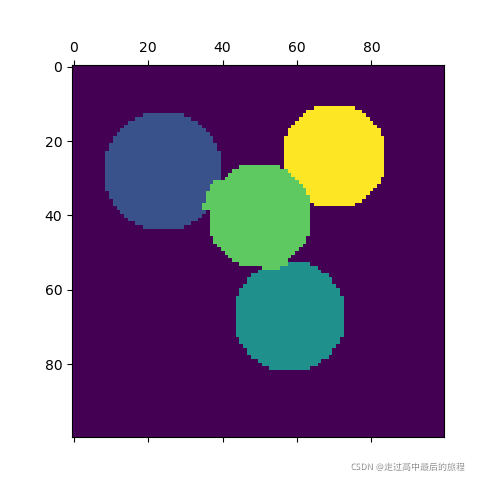
labels = spectral_clustering(graph, n_clusters=4, eigen_solver="arpack")
label_im = np.full(mask.shape, -1.0)
label_im[mask] = labels

plt.matshow(img)
plt.matshow(label_im)

# #############################################################################
# 2 circles
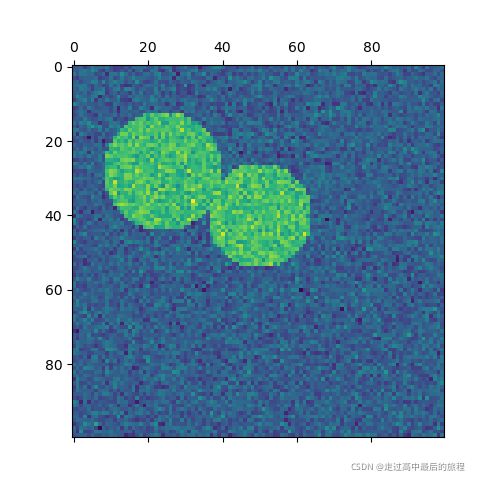
img = circle1 + circle2
mask = img.astype(bool)
img = img.astype(float)

img += 1 + 0.2 * np.random.randn(*img.shape)

graph = image.img_to_graph(img, mask=mask)
graph.data = np.exp(-graph.data / graph.data.std())

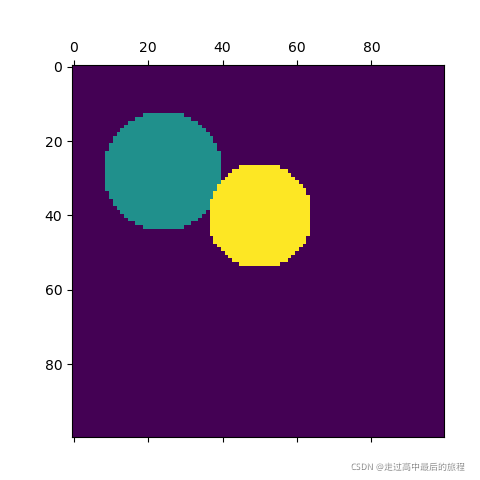
labels = spectral_clustering(graph, n_clusters=2, eigen_solver="arpack")
label_im = np.full(mask.shape, -1.0)
label_im[mask] = labels

plt.matshow(img)
plt.matshow(label_im)

plt.show()
[1] Normalized cuts and image segmentation, 2000 Jianbo Shi, Jitendra Malik
[2] A Tutorial on Spectral Clustering, 2007 Ulrike von Luxburg
[3] Multiclass spectral clustering, 2003 Stella X. Yu, Jianbo Shi
[4] Toward the Optimal Preconditioned Eigensolver: Locally Optimal Block Preconditioned Conjugate Gradient Method, 2001. A. V. Knyazev SIAM Journal on Scientific Computing 23, no. 2, pp. 517-541.


