大数据背景下的银行智能销售体系建设——基于XGBoost算法的银行产品销售情况分析
概要
一个数据科学项目。通过对客户的信息分析、客户与银行的通话信息分析、经济情况分析和相关其它信息分析,来判断最有可能购买银行存款产品的群体,从而对其做出智能的推荐。
1.问题分析
1.1.相关背景
该数据与葡萄牙银行机构的直接营销活动(电话)有关,我们的最终目标是预测客户是否将会定期存款(变量y),为了访问产品(银行定期存款)是否被订阅,通常需要与同一客户进行多次联系。
1.2.属性信息
1.2.1.银行客户信息:bank_client
1.age:int类型,代表年龄
2.job:string类型,代表职业,共12种(‘admin.’, ‘blue-collar’, ‘entrepreneur’, ‘housemaid’, ‘management’, ‘retired’,
‘self-employed’, ‘services’, ‘student’, ‘technician’, ‘unemployed’, ‘unknown’)
3.marital:string类型,代表婚姻情况,共4种(‘divorced’, ‘married’, ‘single’, ‘unknown’)
4.education:string类型,代表教育情况,共8种(‘illiterate’,‘basic.4y’,‘basic.6y’,‘basic.9y’,‘high.school’,‘professional.course’,
‘university.degree’,‘unknown’)
5.default:string类型,代表是否有违约信用(‘no’, ‘yes’, ‘unknown’)
6.housing:string类型,代表是否有房(‘no’, ‘yes’, ‘unknown’)
7.loan:string类型,代表是否有个人贷款(‘no’, ‘yes’, ‘unknown’)
1.2.2.最后一次与相关人员联系的信息:bank_contact
8.contact:string类型,代表联系方式(‘cellular’,‘telephone’)
9.month:string类型,代表月份(‘jan’, ‘feb’, ‘mar’, …, ‘nov’, ‘dec’)
10.day_of_week:string类型,代表最后联系的天,周末不上班(‘mon’,‘tue’,‘wed’,‘thu’,‘fri’)
11.duration:double类型,代表最后一次联系的持续时间,以秒为单位
注:duration对结果的影响度非常高,如果duration=0那么y=’no’。
1.2.3.社交和经济背景信息:bank_economical
12.emp.var.rate:double类型,代表就业变动率-季度
13.cons.price.idx:double类型,代表消费物价指数-月
14.cons.conf.idx:double类型,代表消费者信心指数-月
15.euribor3m:double类型,代表欧元3个月利率-日
16.nr.employed:double类型,代表员工人数-季度
1.2.4.其它信息:bank_another
17.campaign:int类型,代表此客户与相关人员的通话数量
18.pdays:int类型,距离最后一次联系相关人员的天数(999代表没有联系过)
19.previous:int类型,代表在此产品上线之前和客户联系的次数
20.poutcome:string类型,代表营销的结果(‘failure’,‘nonexistent’,‘success’)
1.2.5.结果
y:string类型,代表是否订阅定期存款产品
2.数据预处理 pre_process.py
2.1.文件总览
#!/usr/bin/env python
# -*- coding: utf-8 -*-
import pandas as pd


def generate_file():
   result = []
   with open('bank-additional-full.csv', encoding='utf-8') as fp:
       for line in fp:
           line = line.replace('"', '').replace('\n', '').replace(' ', '').split(';')
           result.append(line)

   del (result[0])
   df = pd.DataFrame(result, columns=['age', 'job', 'marital', 'education', 'default', 'housing', 'loan', 'contact',
                                      'month', 'day_of_week', 'duration', 'campaign', 'pdays', 'previous', 'poutcome',
                                      'emp.var.rate', 'cons.price.idx', 'cons.conf.idx', 'euribor3m', 'nr.employed',
                                      'y'])
   df.to_csv('dataset.csv', index=0)


def show_information():
   fp = pd.read_csv('dataset.csv')
   print('types:')
   print(fp.dtypes, '\n')
   print('null:')
   print(fp.isnull().any())


if __name__ == '__main__':
   # generate_file()
   # show_information()
处理前的数据形式

处理后的数据形式

2.1.1.generate_file()
通过python原生的函数来处理文件,将文件转化为一个DataFrame结构,之所以不用pandas包下的read_csv()函数是因为python原生函数对文件中某行的字符处理要更为友善。
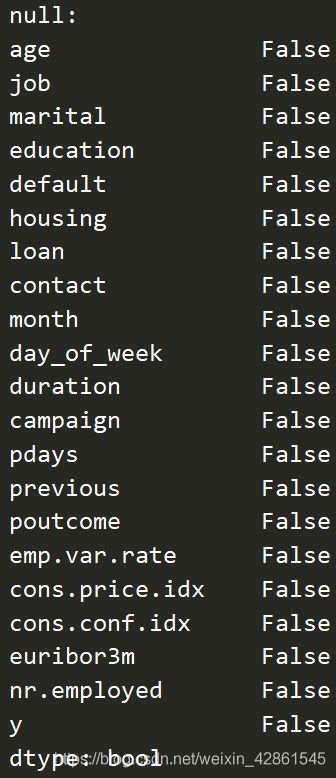
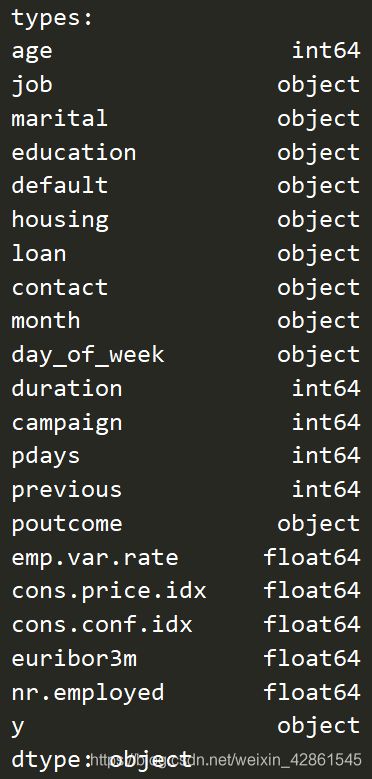
2.1.2.show_information()
展示所生成文件每个特征的数据类型和是否有缺失值,可以看出,数据为object,int64和float64类型,同时数据完整,没有缺失值
2.2. 使用SPSS将数据可视化
通过生成的dataset.csv将数据导入SPSS依次生成堆积图,结果如下
2.2.1.银行客户信息分析(7个特征)


age:由直方图可知,年龄的分布是离散化的,仅仅看这个图表我们不能得出结论如果年龄对y有很大影响。与此同时,年龄在偏高的地方呈断崖式下跌,若不经过处理则会影响模型准确性。
job:由直方图可知,退休人员和学生的订阅率最高,这两类人员种缺乏相关理财知识的人占比较高,所以大多会选择风险低的定期存款。因此可以多向这两类人群投送广告,同时其他相同工作层次的人订阅率相差不大。
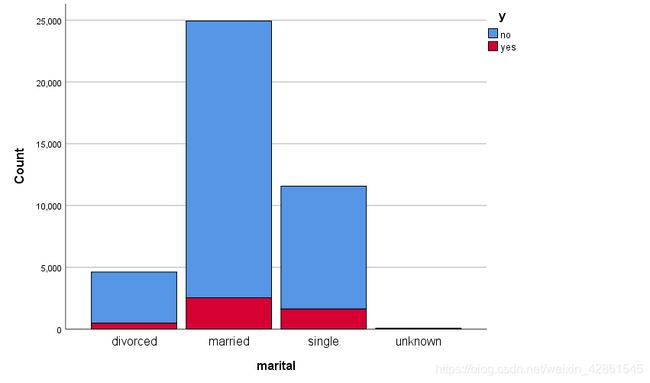

marital:由直方图可知,单身人群存款比例更高。
education:由直方图可知,大学生的存款比例最高。
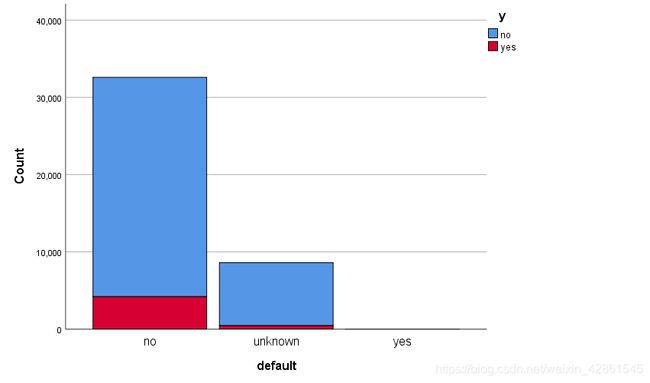

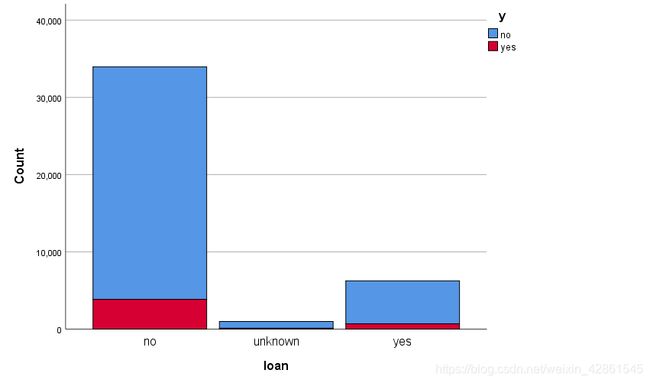
default:由直方图可推断,有违约信用的几乎不存款。
housing:由直方图可知,是否有房存款的比例差别不大。
loan:由直方图可知,是否贷款与是否存款比例差距不大。
2.2.2.最后一次与相关人员联系的信息分析(4个特征)


contact:由直方图可知,使用手机联系的存款比例较高,推测使用手机的可能家庭较富裕
month:由直方图可知,五月的存款比例最低
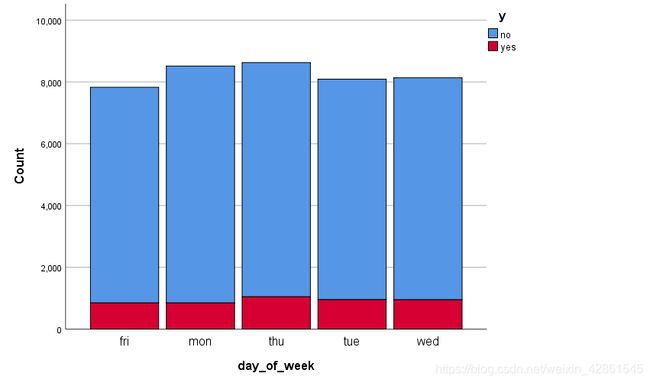

day_of_week: 由直方图可知,在每个工作日存款人数比例接近
duration: 由直方图可知,数据分布过于离散,需要进行进一步的处理
2.2.3.社交和经济背景信息分析(5个特征)


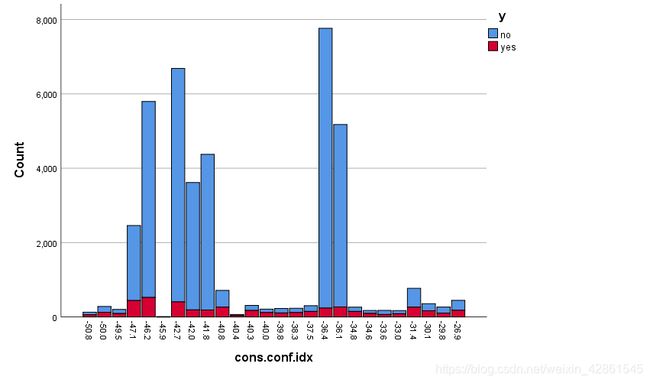
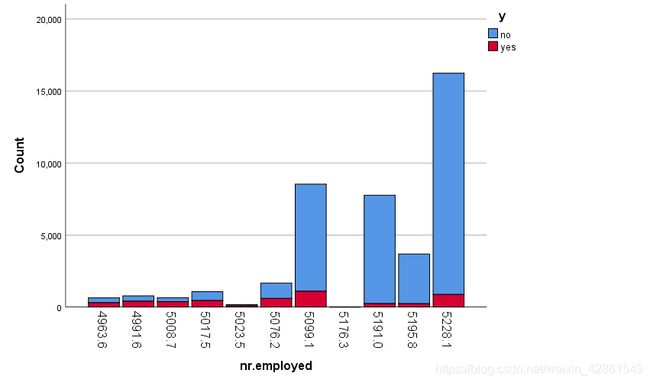

由直方图可得,经济类的五个特征表现出相似的行为。
2.2.4.其它信息分析(4个特征)
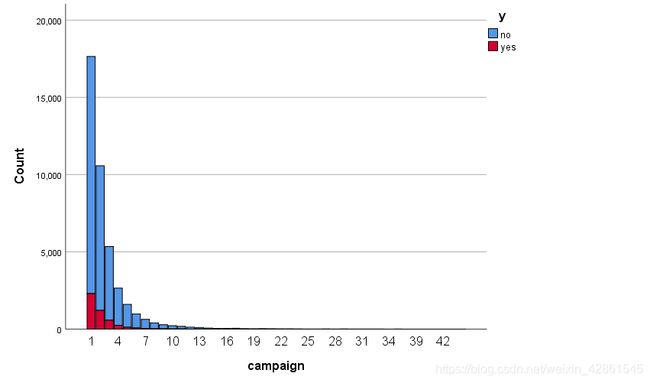

campaign:由直方图可得,银行工作人员跟客户联系持续的时间越长,客户订阅产品的概率越大。
pdays:由直方图可得,客户在产品出来前如果联系相关人员,订阅率几乎为百分之百,这说明了产品宣传的重要性。


previous:由直方图可得,联系次数越多,存款的几率越大
poutcome:由直方图可得,营销结果成功的情况下,存款几率很高
2.2.5.综合分析
去掉离群样本的特征:age, duration, campaign,共3个
手动编码的特征:education,共1个
LabelEncoder编码的特征:job, marital, default, loan, contact, month, poutcome,共6个
放缩的特征:age, duration, euribor3m, pdays,共5个
不需要处理的特征:previous,emp.var.rate, cons.price.idx, cons.conf.idx, nr.emplyed,共6个
意义不大的特征:housing, day_of_week,共2个
3.特征工程 feature_engineer.py
3.1.代码概览
#!/usr/bin/env python
# -*- coding: utf-8 -*-
import matplotlib.pyplot as plt
import pandas as pd
import seaborn as sns
from pandas import DataFrame as dF
from sklearn.preprocessing import LabelEncoder


# 20 columns + y
# ['age', 'job', 'marital', 'education', 'default', 'housing', 'loan'] 'housing' is useless
# ['contact', 'month', 'day_of_week', 'duration'] 'day_of_week' is useless
# ['campaign', 'pdays', 'previous', 'poutcome']
# ['emp.var.rate', 'cons.price.idx', 'cons.conf.idx', 'euribor3m', 'nr.employed']
def process():
    filename = 'dataset.csv'
    bank = pd.read_csv(filename)
    label_encoder = LabelEncoder()
    bank.drop('housing', axis=1, inplace=True)
    bank.drop('day_of_week', axis=1, inplace=True)
    bank = remove_outliers(bank, 'age', low=True, high=True)
    bank = remove_outliers(bank, 'campaign', low=False, high=True)
    bank = remove_outliers(bank, 'duration', low=False, high=True)

    # 6 columns of 7
    bank_client = bank.loc[:, ['age', 'job', 'marital', 'education', 'default', 'loan']]
    process_bank_client(bank_client, label_encoder)
    # 3 columns of 4
    bank_contact = bank.loc[:, ['contact', 'month', 'duration']]
    process_bank_contact(bank_contact, label_encoder)
    # 5 columns
    bank_economy = bank.loc[:, ['emp.var.rate', 'cons.price.idx', 'cons.conf.idx', 'euribor3m', 'nr.employed']]
    process_bank_economy(bank_economy, label_encoder)
    # 4 columns
    bank_another = bank.loc[:, ['campaign', 'pdays', 'previous', 'poutcome']]
    process_bank_another(bank_another, label_encoder)

    bank_ret = pd.concat([bank_client, bank_contact, bank_economy, bank_another], axis=1)
    y = bank.loc[:, ['y']]
    y['y'].replace(['no', 'yes'], [0, 1], inplace=True)
    # show(bank_ret)
    return bank_ret, y


def process_bank_client(client, label_encoder):
    """Process the information of client with 6 columns"""
    q1 = client['age'].quantile(0.25)
    q2 = client['age'].quantile(0.5)
    q3 = client['age'].quantile(0.75)
    client.loc[client['age'] <= q1, 'age'] = 1
    client.loc[(client['age'] > q1) & (client['age'] <= q2), 'age'] = 2
    client.loc[(client['age'] > q2) & (client['age'] <= q3), 'age'] = 3
    client.loc[client['age'] > q3, 'age'] = 4

    client['job'] = label_encoder.fit_transform(client['job'])
    client['marital'] = label_encoder.fit_transform(client['marital'])
    client['education'].replace(['unknown', 'illiterate', 'basic.4y', 'basic.6y', 'basic.9y', 'high.school',
                                 'professional.course', 'university.degree', ], [1, 2, 3, 4, 5, 6, 7, 8], inplace=True)
    client['default'] = label_encoder.fit_transform(client['default'])
    client['loan'] = label_encoder.fit_transform(client['loan'])


def process_bank_contact(contact, label_encoder):
    """Process the information of contact with 3 columns"""
    q1 = contact['duration'].quantile(0.25)
    q2 = contact['duration'].quantile(0.5)
    q3 = contact['duration'].quantile(0.75)
    contact.loc[contact['duration'] <= q1, 'duration'] = 1
    contact.loc[(contact['duration'] > q1) & (contact['duration'] <= q2), 'duration'] = 2
    contact.loc[(contact['duration'] > q2) & (contact['duration'] <= q3), 'duration'] = 3
    contact.loc[contact['duration'] > q3, 'duration'] = 4

    contact['contact'] = label_encoder.fit_transform(contact['contact'])
    contact['month'] = label_encoder.fit_transform(contact['month'])


def process_bank_economy(economy, label_encoder):
    """Process the information of economy with 5 columns"""
    economy.loc[(economy['euribor3m'] <= 1), 'euribor3m'] = 1
    economy.loc[(economy['euribor3m'] > 1) & (economy['euribor3m'] <= 2), 'euribor3m'] = 2
    economy.loc[(economy['euribor3m'] > 2) & (economy['euribor3m'] <= 3), 'euribor3m'] = 3
    economy.loc[(economy['euribor3m'] > 3) & (economy['euribor3m'] <= 4), 'euribor3m'] = 4
    economy.loc[(economy['euribor3m'] > 4), 'euribor3m'] = 5


def process_bank_another(another, label_encoder):
    """Process the information of another with 4 columns"""
    another.loc[(another['pdays'] == 999), 'pdays'] = 1
    another.loc[(another['pdays'] > 0) & (another['pdays'] != 999), 'pdays'] = 2
    another['poutcome'] = label_encoder.fit_transform(another['poutcome'])


def remove_outliers(bank, feature, low=False, high=False):
    """Remove the outliers of a specific feature"""
    q1 = bank[feature].quantile(0.25)
    q3 = bank[feature].quantile(0.75)
    iqr = q3 - q1
    low = q1 - 1.5 * iqr if low is True else 0
    high = q3 + 1.5 * iqr if high is True else 0
    bank = bank[(bank[feature] > low) & (bank[feature] < high)]
    return bank


def show(bank_ret):
    plt.figure()
    sns.heatmap(dF.corr(bank_ret), annot=True)
    plt.show()


if __name__ == '__main__':
    process()
3.2.代码分析
3.2.1.通过DataFrame中的drop()函数,处理意义较小的特征:housing, day_of_week
axis: 0代表行,1代表列
inplace:默认False,代表不对原始数据进行修改,此处为True
3.2.2.处理某些特征的离群样本
通过remove_ourliers()函数对离群样本进行去除
def remove_outliers(bank, feature, low=False, high=False):
    """Remove the outliers of a specific feature"""
    q1 = bank[feature].quantile(0.25)
    q3 = bank[feature].quantile(0.75)
    iqr = q3 - q1
    low = q1 - 1.5 * iqr if low is True else 0
    high = q3 + 1.5 * iqr if high is True else 0
    bank = bank[(bank[feature] > low) & (bank[feature] < high)]
    return bank
feature:特征名称
low:代表是否处理左端离群点,默认为False
high:代表是否处理右端离群点,默认为False
IQR值:设q1, q2, q3为特征X的四等分点,则四分位距IQR(Interquartile range)的值为q3–q1,左端离群点的范围为[0, q1–IQR],右端离群点的范围为[q3 + IQR, INF)。
3.2.3.处理银行客户信息
age:去掉离群样本后,通过四等分点来放缩
job, marital, default, loan:通过LabelEncoder的fit_transform()自动编码
education:通过replace()函数手动编码
house:已被删除
def process_bank_client(client, label_encoder):
    """Process the information of client with 6 columns"""
    q1 = client['age'].quantile(0.25)
    q2 = client['age'].quantile(0.5)
    q3 = client['age'].quantile(0.75)
    client.loc[client['age'] <= q1, 'age'] = 1
    client.loc[(client['age'] > q1) & (client['age'] <= q2), 'age'] = 2
    client.loc[(client['age'] > q2) & (client['age'] <= q3), 'age'] = 3
    client.loc[client['age'] > q3, 'age'] = 4

    client['job'] = label_encoder.fit_transform(client['job'])
    client['marital'] = label_encoder.fit_transform(client['marital'])
    client['education'].replace(['unknown', 'illiterate', 'basic.4y', 'basic.6y', 'basic.9y', 'high.school',
                                 'professional.course', 'university.degree', ], [1, 2, 3, 4, 5, 6, 7, 8], inplace=True)
    client['default'] = label_encoder.fit_transform(client['default'])
    client['loan'] = label_encoder.fit_transform(client['loan'])
3.2.4.处理最后一次与相关人员联系的信息
duration:去掉离群样本后,通过四等分点来放缩
contact, month:通过LabelEncoder的fit_transform()自动编码
def process_bank_contact(contact, label_encoder):
    """Process the information of contact with 3 columns"""
    q1 = contact['duration'].quantile(0.25)
    q2 = contact['duration'].quantile(0.5)
    q3 = contact['duration'].quantile(0.75)
    contact.loc[contact['duration'] <= q1, 'duration'] = 1
    contact.loc[(contact['duration'] > q1) & (contact['duration'] <= q2), 'duration'] = 2
    contact.loc[(contact['duration'] > q2) & (contact['duration'] <= q3), 'duration'] = 3
    contact.loc[contact['duration'] > q3, 'duration'] = 4

    contact['contact'] = label_encoder.fit_transform(contact['contact'])
    contact['month'] = label_encoder.fit_transform(contact['month'])
3.2.5.处理经济信息
euribor3m:数据过于密集,结合堆积图进行放缩
emp.var.rate, cons.price.idx, cons.conf.idx, nr.emplyed:float类型,暂不处理
def process_bank_economy(economy, label_encoder):
    """Process the information of economy with 5 columns"""
    economy.loc[(economy['euribor3m'] <= 1), 'euribor3m'] = 1
    economy.loc[(economy['euribor3m'] > 1) & (economy['euribor3m'] <= 2), 'euribor3m'] = 2
    economy.loc[(economy['euribor3m'] > 2) & (economy['euribor3m'] <= 3), 'euribor3m'] = 3
    economy.loc[(economy['euribor3m'] > 3) & (economy['euribor3m'] <= 4), 'euribor3m'] = 4
    economy.loc[(economy['euribor3m'] > 4), 'euribor3m'] = 5
3.2.6.处理其它信息
campaign:int类型,去掉离群样本后不需要处理
pdays:结合堆积图,分为pdays=999和pdays!=999两个类别
previous:int类型,不需要处理
poutcome:通过LabelEncoder的fit_transform()自动编码
def process_bank_another(another, label_encoder):
    """Process the information of another with 4 columns"""
    another.loc[(another['pdays'] == 999), 'pdays'] = 1
    another.loc[(another['pdays'] > 0) & (another['pdays'] != 999), 'pdays'] = 2
    another['poutcome'] = label_encoder.fit_transform(another['poutcome'])
3.2.7.信息整合、协方差矩阵、返回值
调用pandas中的concat()函数进行信息的整合,其中axis=1代表列的整合
协方差矩阵如下图

可以得到的是
1.各经济指标之间联系极大。
2.previous和经济类指标和contact相关,即经济比较景气的时候银行的相关产品销售情况会好转。
3.marital和age强相关,但是由于marital为自动编码,故无法得出有效结论。
4.模型训练 train_model.py
4.1.代码总览
#!/usr/bin/env python
# -*- coding: utf-8 -*-
import warnings

import matplotlib.pyplot as plt
import numpy as np
import xgboost as xgb
from sklearn.ensemble import AdaBoostClassifier
from sklearn.ensemble import BaggingClassifier
from sklearn.ensemble import GradientBoostingClassifier
from sklearn.ensemble import RandomForestClassifier
from sklearn.linear_model import LogisticRegression
from sklearn.metrics import accuracy_score
from sklearn.model_selection import GridSearchCV
from sklearn.model_selection import KFold
from sklearn.model_selection import cross_val_score
from sklearn.model_selection import train_test_split
from sklearn.neighbors import KNeighborsClassifier
from sklearn.preprocessing import StandardScaler
from sklearn.svm import SVC
from xgboost.sklearn import XGBClassifier

from feature_engineer import process


def main():
    bank, y = process()
    x = ['age', 'job', 'marital', 'education', 'default', 'loan',
         'contact', 'month', 'duration',
         'emp.var.rate', 'cons.price.idx', 'cons.conf.idx', 'euribor3m', 'nr.employed',
         'campaign', 'pdays', 'previous', 'poutcome']
    bank.set_feature_name(x)
    x_train, x_test, y_train, y_test = train_test_split(bank, y, test_size=0.25, random_state=49)

    standard_scaler = StandardScaler()
    x_train = standard_scaler.fit_transform(x_train.astype(np.float64))
    x_test = standard_scaler.transform(x_test.astype(np.float64))
    y_train = np.ravel(y_train)

    # knn_coefficient(x_train, y_train)
    use_knn(x_train, x_test, y_train, y_test)
    use_logistic_regression(x_train, x_test, y_train, y_test)
    use_svm(x_train, x_test, y_train, y_test)
    use_adaboost(x_train, x_test, y_train, y_test)
    use_gradient_boost(x_train, x_test, y_train, y_test)
    use_bagging(x_train, x_test, y_train, y_test)
    # xgboost_coefficient(x_train, y_train)
    use_xgboost(x_train, x_test, y_train, y_test)
    use_random_forest(x_train, x_test, y_train, y_test)
    # use_xgboost_optimization(x_train, x_test, y_train, y_test)


def knn_coefficient(x_train, y_train):
    """Calculate the coefficient of kNN, and the best value of k is 22"""
    ks = range(1, 26)
    cv_scores = []
    for k in ks:
        knn = KNeighborsClassifier(n_neighbors=k, weights='uniform', p=2, metric='euclidean')
        score = cross_val_score(knn, x_train, y_train, cv=k_fold, scoring='accuracy')
        cv_scores.append(score.mean())
        print(f'k = {k}, accuracy = {score.mean()}')

    best_k = ks[cv_scores.index(max(cv_scores))]
    print(best_k)
    plt.plot(ks, cv_scores)
    plt.scatter(best_k, cv_scores[best_k - 1], c='r')
    plt.xlabel('k')
    plt.ylabel('Accuracy')
    plt.show()


def use_knn(x_train, x_test, y_train, y_test):
    knn = KNeighborsClassifier(n_neighbors=23)
    process_clf(x_train, x_test, y_train, y_test, 'kNN', knn)


def use_logistic_regression(x_train, x_test, y_train, y_test):
    logistic_regression = LogisticRegression(solver='lbfgs')
    process_clf(x_train, x_test, y_train, y_test, 'logistic regression', logistic_regression)


def use_svm(x_train, x_test, y_train, y_test):
    svc = SVC(kernel='sigmoid', gamma='auto')
    svc.fit(x_train, y_train)
    cv_svm = cross_val_score(svc, x_train, y_train, cv=k_fold, n_jobs=1, scoring='accuracy', error_score='raise').mean()
    print('svm:', cv_svm)


def use_adaboost(x_train, x_test, y_train, y_test):
    adaboost = AdaBoostClassifier()
    process_clf(x_train, x_test, y_train, y_test, 'adaboost', adaboost)


def use_gradient_boost(x_train, x_test, y_train, y_test):
    gradient_boost = GradientBoostingClassifier()
    process_clf(x_train, x_test, y_train, y_test, 'gradient_boost', gradient_boost)


def xgboost_coefficient(x_train, y_train):
    cv_params = {'n_estimators’: [400, 500, 600, 700, 800]}
    params = {'learning_rate': 0.1,
              'n_estimators': 330,
              'max_depth': 3,
              'min_child_weight': 6,
              'random_state': 0,
              'subsample': 0.6,
              'colsample_bytree': 0.9,
              'gamma': 0,
              'reg_alpha': 3,
              'reg_lambda': 0.05}
    xgboost = XGBClassifier(**params)
    optimized_xgboost = GridSearchCV(estimator=xgboost, param_grid=cv_params, scoring='r2', cv=5, verbose=1, n_jobs=4)
    optimized_xgboost.fit(x_train, y_train)
    print(f'learning_rate:{optimized_xgboost.best_params_}')


def use_xgboost(x_train, x_test, y_train, y_test):
    xgboost = XGBClassifier()
    process_clf(x_train, x_test, y_train, y_test, 'xgboost', xgboost)


def use_xgboost_optimization(x_train, x_test, y_train, y_test):
    xgboost = XGBClassifier(learning_rate=0.1,
                            n_estimators=330,
                            max_depth=3,
                            min_child_weight=6,
                            random_state=0,
                            subsample=0.6,
                            colsample_bytree=0.9,
                            gamma=0,
                            reg_alpha=3,
                            reg_lambda=0.05)
    process_clf(x_train, x_test, y_train, y_test, 'xgboost', xgboost)
    xgboost.get_booster().feature_names = ['age', 'job', 'marital', 'education', 'default', 'loan',
                                           'contact', 'month', 'duration',
                                           'emp.var.rate', 'cons.price.idx', 'cons.conf.idx', 'euribor3m',
                                           'nr.employed',
                                           'campaign', 'pdays', 'previous', 'poutcome']
    xgb.plot_importance(xgboost)
    plt.show()


def use_bagging(x_train, x_test, y_train, y_test):
    bagging = BaggingClassifier()
    process_clf(x_train, x_test, y_train, y_test, 'bagging', bagging)


def use_random_forest(x_train, x_test, y_train, y_test):
    random_forest = RandomForestClassifier(n_estimators=200)
    random_forest.fit(x_train, y_train)
    cv_random_forest = cross_val_score(random_forest, x_train, y_train, cv=k_fold, n_jobs=1, scoring='accuracy').mean()
    print('random forest:', cv_random_forest)


def process_clf(x_train, x_test, y_train, y_test, name, clf):
    """Print confusion matrix, accuracy score"""
    clf.fit(x_train, y_train)
    predict = clf.predict(x_test).ravel()
    score = accuracy_score(y_test, predict)
    print(name + ':', score)


if __name__ == '__main__':
    warnings.simplefilter('error')
    k_fold = KFold(n_splits=10, shuffle=True, random_state=1)
    main()
4.2.main()函数
使用多种算法来拟合数据:包括kNN,logistic回归,svm,adaboost,gradient boost,bagging,xgboost,随机森林,排除过于初级效果也偏低的决策树和朴素贝叶斯
4.2.1.kNN
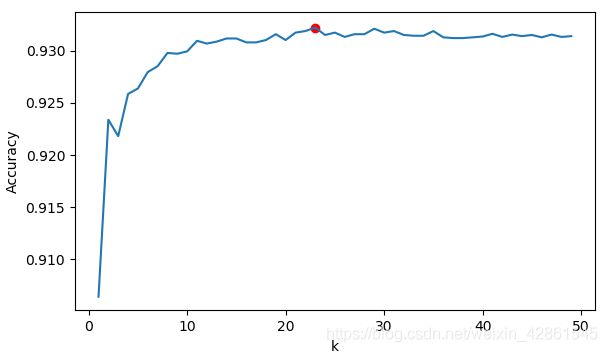
使用knn_coefficient函数来确定knn的k值
def knn_coefficient(x_train, y_train):
    """Calculate the coefficient of kNN, and the best value of k is 22"""
    ks = range(1, 26)
    cv_scores = []
    for k in ks:
        knn = KNeighborsClassifier(n_neighbors=k, weights='uniform', p=2, metric='euclidean')
        score = cross_val_score(knn, x_train, y_train, cv=k_fold, scoring='accuracy')
        cv_scores.append(score.mean())
        print(f'k = {k}, accuracy = {score.mean()}')

    best_k = ks[cv_scores.index(max(cv_scores))]
    print(best_k)
    plt.plot(ks, cv_scores)
    plt.scatter(best_k, cv_scores[best_k - 1], c='r')
    plt.xlabel('k')
    plt.ylabel('Accuracy')
    plt.show()
4.2.2.多种算法&结果分析
调用多种算法来进行结果检验,可以看出,kNN调参后达到了0.93的准确率。纵观选择的所有算法,准确率在0.934以上的有gradient boost,xgboost。
同时,logistic回归和boost类算法的运行速度很快,远远超过其它的算法。由此可得,boost算法在此数据集上的表现要超过其余算法,综合算法的性能来看,选择功能比较强大的xgboost进行进一步的参数调节。

4.2.3.xgboost及调参
xgboost(Extrame Gradient Boost)算法,是由Tianqi Chen最初开发的实现可扩展,便携,分布式 gradient boosting (GBDT, GBRT or GBM) 算法的一个库,所应用的算法是Gradient Boosting Decision Tree,既可以用于分类也可以用于回归。Boosting算法的核心是将很多弱分类器f_i(x)组合起来形成强分类器F(X)的一种方法。我们对其的调参如下。
1)参数初始化
 params = {'learning_rate': 0.1,
              'n_estimators': 330,
              'max_depth': 3,
              'min_child_weight': 6,
              'random_state': 0,
              'subsample': 0.6,
              'colsample_bytree': 0.9,
              'gamma': 0,
              'reg_alpha': 3,
              'reg_lambda': 0.05}
learning_rate:学习率,代表算法往最佳点收缩的速率,默认为0.1,初始化为0.1。
n_estimators:算法构造树的数量,即最佳迭代次数,默认为100,初始化为500。
max_depth:树的最大深度,max_depth的值越大,则算法越容易过拟合,默认为6,初始化5。
min_child_weight:孩子结点中最小的样本权重和,如果某个叶子结点的样本权重和小于min_child_weight则炒粉过程结束。min_child_weight越大,算法越保守,默认为1,初始化为1。
random_state:随机数种子,与之前版本的seed意义相同,默认为0,初始化为0。
subsample:用于训练模型的子样本占整个样本集合的比例,默认为1,初始化为0.8。
colsample_bytree:在建立树时对特征采样的比例,默认为1,初始化为0.8。
gamma:在树的叶结点上进一步分离所需的最小损失值,gamma越大,算法越保守,默认为0,初始化为0。
reg_alpha:L1正则化项的权重(类似于Lasso回归),默认为0,初始化为0。
reg_lambda:关于权重的L2正则项(类似于岭回归),默认为1,初始化为1。
2)参数调整步骤
通过cv_params字典来进行参数的保存,如n_estimators中的待选值保存为
cv_params = {'n_estimators’: [400, 500, 600, 700, 800]}。
反复更改cv_params中的参数以及待选值来得到最终的参数。
在这些参数中,最重要的参数为n_estimators和learning_rate,n_estimators极大影响算法的准确度,learning_rate极大地影响算法的性能。
3)n_estimators的调整
令n_estimators分别取 [400, 500, 600, 700, 800]。

当前最佳取值为400,我们选择的数据跨度较大,比较粗糙。
选择更为精细的区间,经过多次调整后得到

n_estimators的最佳取值为330。
4)max_depth和min_child_weight的调整
令max_depth分别取[3, 4, 5, 6, 7, 8, 9, 10],min_child_weight分别取[1, 2, 3, 4, 5, 6]。

max_depth的最佳取值为3,min_child_weight的最佳取值为6。
5)subsample和colsample_bytree的调整
令subsample分别取[0.6, 0.7, 0.8, 0.9],colsample_bytree分别取[0.6, 0.7, 0.8, 0.9]。

subsample的最佳取值为0.6,colsample_bytree的最佳取值为0.9。
6)reg_alpha和reg_lambda的调整
令reg_alpha分别取[0.05, 0.1, 1, 2, 3],reg_lambda分别取[0.05, 0.1, 1, 2, 3]。

reg_alpha的最佳取值为3,reg_lambda的最佳取值为0.05。
7)learning_rate的调整

learning_rate的最佳取值为0.1,与初始化值相同。
8)参数调整汇总
n_estimators:330
max_depth:3
min_child_weight:6
subsample:0.6
colsample_bytree:0.9
reg_alpha:3
reg_lambda:0.5
learning_rate:0.1
将参数输入到模型中进行检验。
4.2.4.xgboost的使用
将参数更新后运行,得到结果如下

准确率为94.15%,比调参前提高了一个百分点。
5.数据可视化
通过xgboost包下的plot_importance()函数来对特征的重要性进行图像化地输出。

特征的重要度从高到低排行分别为
影响大1-6:duration, cons.price.idx, month, cons.conf.idx, job, education
影响中等7-11:age, campaign, emp.var.rate, poutcome, nr.employed
影响小12-17:contact, marital, previous, loan, default, euribor3m
未出现:pdays,推测可能是因为样本分布过于不均衡(pdays!=999的几乎没有)所以特征不具有代表性。
6.数据洞察
通过数据可视化,可以看出,duration正是对结果影响最大的特征,与数据集给的信息相吻合。
除此以外,cons.price.idx, month, cons.conf.idx, job, education等特征对客户是否会购买相关银行存款产品的影响也十分大,推出客户的经济状况与当前社会的经济状况(cons.price.idx, month, cons.conf.idx等)与是否会购买银行的相关存款产品存在较大的关联性,同时,我们猜测,受教育的程度越高,对于理财的重视程度也就越高。
通过这些得到的结论,银行可以对其智能销售体系进行建设,如在经济比较景气的时间段内,主要向受过高等教育且工作稳定的客户进行产品的智能推送。
7.参考文献
[1].Henrique Yamahata.Bank Marketing + Classification + ROC,F1,RECALL.https://www.kaggle.com/henriqueyamahata/bank-marketing/kernels
[2].Burak Batıbay.Great Guide of Starters : LightGBM.https://www.kaggle.com/batibayburak/great-guide-of-starters-lightgbm
[3].XGboost数据比赛实战之调参篇(完整流程).https://blog.csdn.net/sinat_35512245/article/details/79700029
[4].XGBoost.维基百科.https://zh.wikipedia.org/wiki/XGBoost
