多元函数的3D可视化实现,数学真是太美了
第一步我们先要安装好模块:
pip install pyMetaheuristic
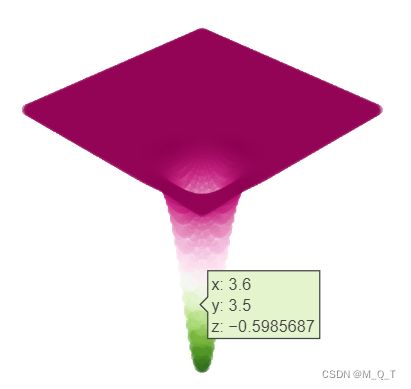
案例一,实现代码如下:
import pyMetaheuristic
import numpy as np

# SCA
from pyMetaheuristic.algorithm import  sine_cosine_algorithm
from pyMetaheuristic.utils import graphs
# 目标函数: Easom Function
def easom(variables_values = [0, 0]):
    x1, x2     = variables_values
    func_value = -np.cos(x1) * np.cos(x2) * np.exp(-(x1 - np.pi) ** 2 - (x2 - np.pi) ** 2)
    return func_value
# 目标函数参数
plot_parameters = {
    'min_values': (-5, -5),
    'max_values': (5, 5),
    'step': (0.1, 0.1),
    'solution': [],
    'proj_view': '3D',
    'view': 'notebook'
}
graphs.plot_single_function(target_function = easom, **plot_parameters)
效果显示:
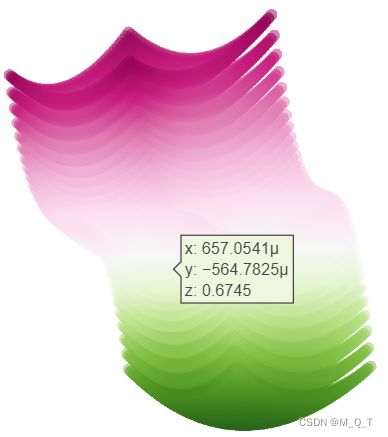
案例二,实现代码如下:
import numpy as np

from pyMetaheuristic.utils import graphs


# 需要绘制的函数,也可是我们的目标函数
def easom(variables_values=[0, 0, 0]):
    x1, x2, x3 = variables_values
    func_value = x1 ** 2 + (x2 - 0.05) ** 2 + x3 ** 3
    return func_value


# 相关参数设置
plot_parameters = {
    # 各个变量最小值
    'min_values': (-5, -5, -5),
    # 各个变量最大值
    'max_values': (5, 5, 5),
    # 步长。建议小一点,图形更细腻
    'step': (0.2, 0.2, 0.2),
    'solution': [],
    'proj_view': '3D',
    'view': 'notebook'
}
print(graphs.plot_single_function(target_function=easom, **plot_parameters))
实现结果显示:
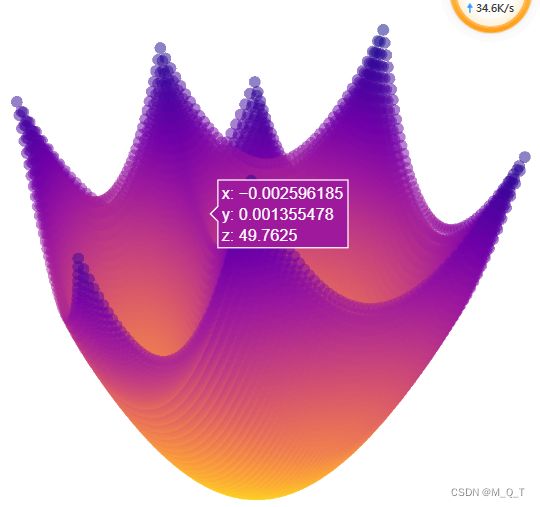
案例三,实现代码如下:
import numpy as np
from pyMetaheuristic.utils import graphs


# 需要绘制的函数,也可是我们的目标函数
def easom(variables_values=[0, 0, 0]):
    x1, x2, x3 = 0,0,0
    func_value = x1 ** 2 + (x2 - 1) ** 2 + x3 ** 3

    return func_value


# 设置参数
plot_parameters = {
    # 各个变量的最小值
    'min_values': (-5, -5),
    # 各个变量的最大值
    'max_values': (5, 5),
    # 步长建议小一点,图形更细腻
    'step': (0.2, 0.2),
    'solution': [],
    # 默认这个
    'proj_view': '3D',
    'view': 'notebook'
}
graphs.plot_single_function(target_function=easom, **plot_parameters)
实现显示:
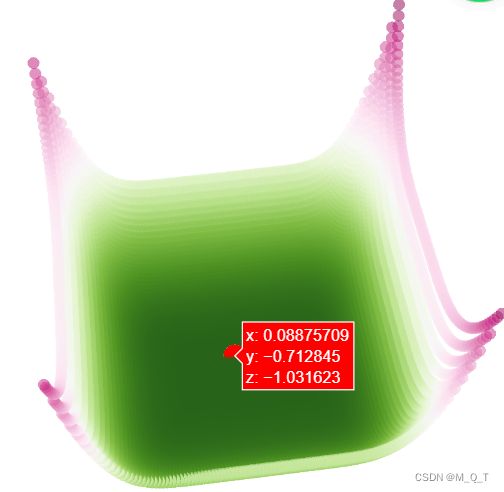
案例四,实现代码如下:
import numpy as np

from pyMetaheuristic.utils import graphs


# 需要绘制的函数,也可是我们的目标函数
def easom(variables_values=[0, 0, 0]):
    x1, x2, x3 = variables_values
    func_value = x1 ** 2 + (x2 - 0.05) ** 2 + x3 ** 2
    return func_value


# 相关参数设置
plot_parameters = {
    # 各个变量最小值
    'min_values': (-5, -5, -5),
    # 各个变量最大值
    'max_values': (5, 5, 5),
    # 步长。建议小一点,图形更细腻
    'step': (0.2, 0.2, 0.2),
    'solution': [],
    'proj_view': '3D',
    'view': 'notebook'
}
print(graphs.plot_single_function(target_function=easom, **plot_parameters))
代码实现显示:
这里推荐大家看一篇文章,该博主很好地利用了上面的图形来进行正余弦优化算法(SCA)对多元函数寻优http://t.csdn.cn/lRR75
这里我进行一下展示;
# Required Libraries
import numpy as np

# SCA
from pyMetaheuristic.algorithm import  sine_cosine_algorithm
from pyMetaheuristic.utils import graphs

# 目标函数:
def easom(variables_values = [0, 0]):
    x1, x2     = variables_values
    func_value = 4 * x1 ** 2 - 2.1 * x1 ** 4 + (1 / 3) * x1 ** 6 + x1 * x2 - 4 * x2 ** 2 + 4 * x2 ** 4
    return func_value

# 目标函数参数
plot_parameters = {
    'min_values': (-5, -5),
    'max_values': (5, 5),
    'step': (0.1, 0.1),
    'solution': [],
    'proj_view': '3D',
    'view': 'notebook'
}
graphs.plot_single_function(target_function = easom, **plot_parameters)


# SCA - 参数
parameters = {
    # 候选解个数。
    'solutions': 200,
    'min_values': (-5, -5),
    'max_values': (5, 5),
    # 迭代次数
    'iterations': 500,
    # 两个未知数
    'a_linear_component': 2,
    'verbose': True
}

# SCA - 算法
sca = sine_cosine_algorithm(target_function = easom, **parameters)


# SCA - 最优解
variables = sca[:-1]
minimum   = sca[ -1]
print('变量最优解s: ', np.around(variables, 4) , '最小值: ', round(minimum, 4) )


# SA - 可视化最优解
plot_parameters = {
    'min_values': (-5, -5),
    'max_values': (5, 5),
    'step': (0.1, 0.1),
    'solution': [variables],
    'proj_view': '3D',
    'view': 'notebook'
}
graphs.plot_single_function(target_function = easom, **plot_parameters)
运行结果:
参考:http://t.csdn.cn/lRR75


