机器学习算法--Logistic回归
机器学习算法--Logistic回归
-
- 引入
- 参数学习
- 代码实例
- 分析
- 优化
逻辑回归是一种常用的处理二分类的线性模型。
引入
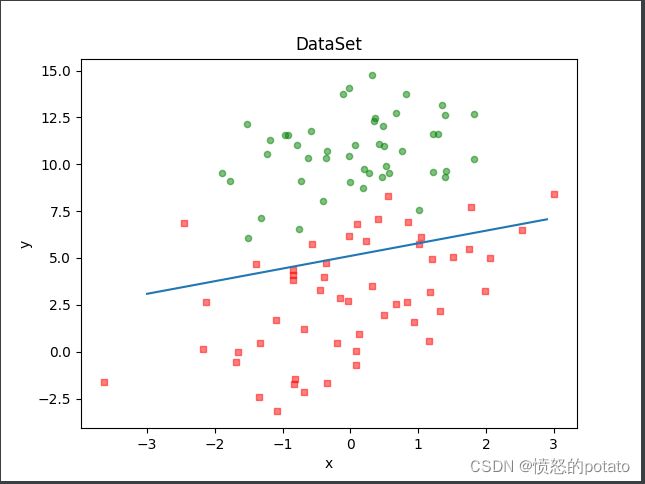
如上图所示在许多情况下,线性函数并不适用于分类为题。为解决线性函数不适合进行分类的问题,我们引入非线性函数g:R^D->(0,1)来预测类别标签的后验概率p(y=1|x)
p(y=1|x) = g(f(x;w))
其中g(.)通常被称为激活函数,其作用是把线性函数的实值域压缩到(0,1)之间,可以用来表示概率
在logistics回归中,我们使用logistic函数作为激活函数,则,标签为1的后验概率为
这里 ![]()
标签为0的后验概率为

参数学习
logistic回归采用交叉熵作为损失函数,并采用梯度下降法来对参数进行优化。
给定N个训练样样本
![]()
用logistic回归模型对每个样本x^((n))进行预测,输出其标签为1的后验概率,记为y ̂^((n))
![]()
由于![]()

使用交叉熵损失函数,其风险函数是

风险函数关于w的偏导数是:

采用梯度下降算法,logistic回归的训练过程为:初始化w0 <- 0,然后通过下式来迭代更新参数:

其中,α是学习率,![]() 是当参数是
是当参数是![]() 的时候,logistic模型的输出
的时候,logistic模型的输出
代码实例
import numpy as np
import matplotlib.pyplot as plt


def loadDataSet(filename):
    """
    加载数据
    :param
        filename: 文件地址
    :return:
        dataMat:特征数据数组
        labelMat:标签数组
    """
    dataMat = []
    labelMat = []
    fr = open(filename)
    for line in fr.readlines():
        lineArr = line.strip().split()
        dataMat.append([1.0, float(lineArr[0]), float(lineArr[1])])
        labelMat.append(int(lineArr[2]))
    fr.close()
    return dataMat, labelMat


def sigMoid(inx):
    """
    sigmoid函数
    :param
        inx:数据
    :return:
        sigmoid函数
    """
    return 1.0 / (1 + np.exp(-inx))


def gradLow(dataMat, labelMat):
    """

    :param
        dataMat: 特征数据
        labelMat: 标签数据
    :return:
        weight.getA():权重数组

    """
    dataMat = np.mat(dataMat)   # (100 X 3)
    labelMat = np.mat(labelMat).transpose()  # (100 X 1)
    m, n = np.shape(dataMat)
    alpha = 1E-2
    presision  = 1E-8
    maxCycles = 500
    k = 0
    weight = np.zeros((n, 1))
    for k in range(0, maxCycles):
        y = sigMoid(dataMat * weight)
        error = labelMat - y
        weight = weight + alpha * dataMat.transpose() * error
    return weight.getA()


def showData(dataMat, labelMat, weight):
    dataMat = np.array(dataMat)
    n = np.shape(dataMat)[0]
    xcord1 = []
    ycord1 = []
    xcord2 = []
    ycord2 = []
    for i in range(0, n):
        if int(labelMat[i]) == 1:
            xcord1.append(dataMat[i, 1])
            ycord1.append(dataMat[i, 2])
        else:
            xcord2.append(dataMat[i, 1])
            ycord2.append(dataMat[i, 2])
    fig = plt.figure()
    ax = fig.add_subplot(111)
    ax.scatter(xcord1, ycord1, s=20, c='red', marker = 's',alpha=.5)
    ax.scatter(xcord2, ycord2, s=20, c='green', alpha=.5)
    x = np.arange(-3.0, 3.0, 0.1)
    y = (-weight[0] - weight[1] * x) / weight[2]
    ax.plot(x, y)
    plt.title('DataSet')
    plt.xlabel('x')
    plt.ylabel('y')
    plt.show()


if __name__ == '__main__':
    dataMat, labelMat = loadDataSet('testSet.txt')
    # print(np.mat(dataMat).transpose().shape)
    # print(np.mat(labelMat).transpose().shape)
    print(gradLow(dataMat, labelMat))
    weight = gradLow(dataMat, labelMat)
    showData(dataMat, labelMat, weight)
    # showData(dataMat, labelMat)
「数据下载 」https://www.aliyundrive.com/s/w2uxjM4NNng 提取码: w97o
分析
风险函数中的1/N是一个正标量,其并不影响风险函数取最小值时x的取值,所以可以将其去掉,因为其会影响参数的收敛速度。
不去掉1/N
收敛次数=500

收敛次数=1000

收敛次数=5000

去掉1/N
迭代次数=500

可以很清的看到,去掉1/N后,所需迭代次数大大减少
优化
按照上述的梯度上升算法在每次更新回归系数(最优参数)时,都需要遍历整个数据集。即
y = sigMoid(dataMat * weight)
每一次都需要遍历所有的数据集,当样本数量小的时候没有问题,但是当需要分析上百万条样本时,这会大大降低我们算法的执行效率,所以我们采取随机梯度下降算法进行优化。即每次优化参数时我们只随机选取一个样本值计算误差。这样会大大减少计算量。
def stocGradAscent1(dataMat, labelMat, maxCycles=150):
    """
    随机梯度下降算法
    :param
        dataMat: 特征数据
        labelMat: 标签数据
        maxCycles: 最大迭代次数
    :return:
        weights:更新后的权重
    """
    m, n = np.shape(dataMat)  # 返回dataMatrix的大小。m为行数,n为列数。
    weights = np.ones(n)  # 参数初始化
    for j in range(maxCycles):
        dataIndex = list(range(m))
        for i in range(m):
            alpha = 4 / (1.0 + j + i) + 0.01  # 降低alpha的大小,每次减小1/(j+i)。
            randIndex = int(np.random.uniform(0, len(dataIndex)))  # 随机选取样本
            h = sigMoid(sum(dataMat[randIndex] * weights))  # 选择随机选取的一个样本,计算h
            error = labelMat[randIndex] - h  # 计算误差
            weights = weights + alpha * error * dataMat[randIndex]  # 更新回归系数
            del (dataIndex[randIndex])  # 删除已经使用的样本
    return weights
该算法第一个改进之处在于,alpha在每次迭代的时候都会调整,并且,虽然alpha会随着迭代次数不断减小,但永远不会减小到0,因为这里还存在一个常数项。必须这样做的原因是为了保证在多次迭代之后新数据仍然具有一定的影响。如果需要处理的问题是动态变化的,那么可以适当加大上述常数项,来确保新的值获得更大的回归系数。另一点值得注意的是,在降低alpha的函数中,alpha每次减少1/(j+i),其中j是迭代次数,i是样本点的下标。第二个改进的地方在于跟新回归系数(最优参数)时,只使用一个样本点,并且选择的样本点是随机的,每次迭代不使用已经用过的样本点。这样的方法,就有效地减少了计算量,并保证了回归效果。
样本数据量小的时候使用基础梯度下降算法
样本数据量大的时候使用随机梯度下降算法
