seaborn封裝-对每个特征绘制单独子图进行快速可视化
一、数值特征分布图:箱线图、直方图、密度图
二、数值特征估计图:柱状图
三、离散特征统计图:柱状图、饼图
作者封装了一些常用于可视化分析每个特征的特征分布等的函数,便于遇到类似的问题能够快速进行可视化,接下来作者会给出每个封装函数的具体程序以及使用方法,便于需要者快速绘制效果图。
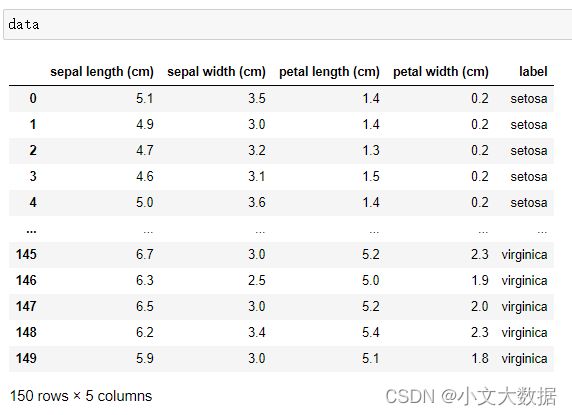
首先调用鸢尾花数据集:
# 所需模块
import pandas as pd
import numpy as np
import matplotlib.pyplot as plt
import seaborn as sns
import random
# sns.set()全局风格设置 simhei显示中文
sns.set_style('whitegrid',rc = {'font.family': 'SimHei'})

# 调用鸢尾花数据集
from sklearn import datasets

iris = datasets.load_iris()
data = iris.data

data = pd.DataFrame(data,columns = iris.feature_names)
data['label'] = iris.target
data['label'].replace({0:iris.target_names[0],1:iris.target_names[1],2:iris.target_names[2]},inplace = True)
data
获取颜色
def get_colors(color_style):
    cnames = sns.xkcd_rgb
    if color_style =='light':
        colors = list(filter(lambda x:x[:5]=='light',cnames.keys()))
    elif color_style =='dark':
        colors = list(filter(lambda x:x[:4]=='dark',cnames.keys()))
    elif color_style =='all':
        colors = cnames.keys()
    colors = list(map(lambda x:cnames[x], colors))
    return colors
封装函数通用参数介绍:
data:传入dataframe类型数据
rows:子图行数
cols:子图列数
figszie:画布大小
vars:所涉及的特征(参考seaborn绘图函数中的vars)
hue:分类类别
color_style = 'light':可指定参数'all'、'light'、'dark',分别代表随机所有颜色、亮、暗。
subplots_adjust:调整子图横竖的间隔
一、数值特征分布图:箱线图、直方图、密度图
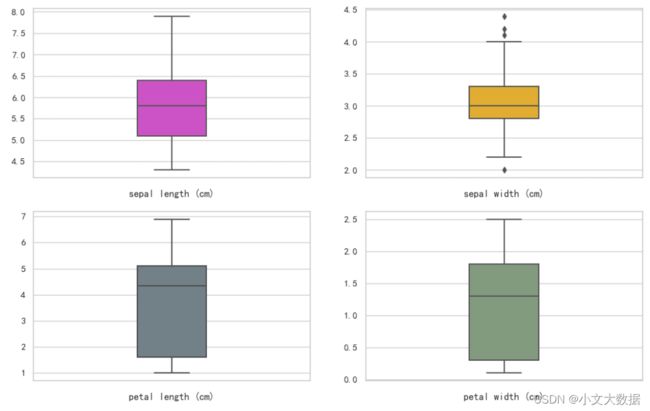
1、箱线图:快速对数值型数据进行箱线图绘制,分析其特征分布、均值、异常值等。
参数:width:箱线宽度
def boxplot(data, rows = 3, cols = 4, figsize = (13, 8), vars  =None, hue = None, width = 0.25,
            order = None, color_style ='light',subplots_adjust = (0.2, 0.2)):

    fig = plt.figure(figsize = figsize)
    hue = data[hue] if isinstance(hue,str) and hue in data.columns else hue
    data = data if not vars else data[vars]

    colors = get_colors(color_style)
    ax_num = 1
    for col in data.columns:
        if isinstance(data[col].values[0],(np.int64,np.int32,np.int16,np.int8,np.float16,np.float32,np.float64)):
            plt.subplot(rows, cols, ax_num)
            sns.boxplot(x = hue,y = data[col].values,color=random.sample(colors,1)[0],width= width,order = order)
            plt.xlabel(col)
#             data[col].plot(kind = 'box',color=random.sample(colors,1)[0])
            ax_num+=1

plt.subplots_adjust(hspace = subplots_adjust[0],wspace=subplots_adjust[1])boxplot(data,2,2,color_style='all')使用hue参数指定类别:
with sns.axes_style('white'):
    boxplot(data,2,2,color_style='all',hue= 'label', width = 0.5)
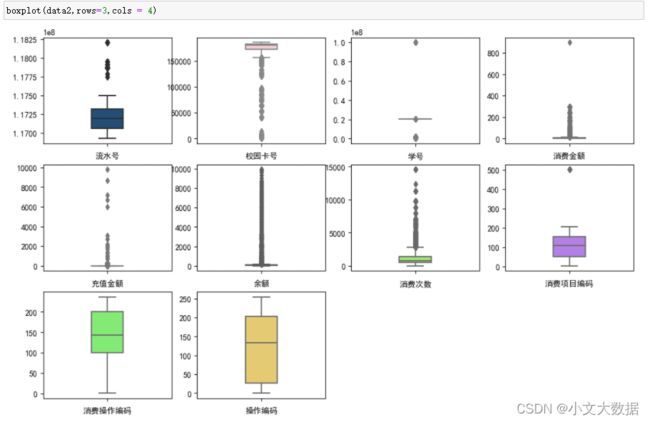
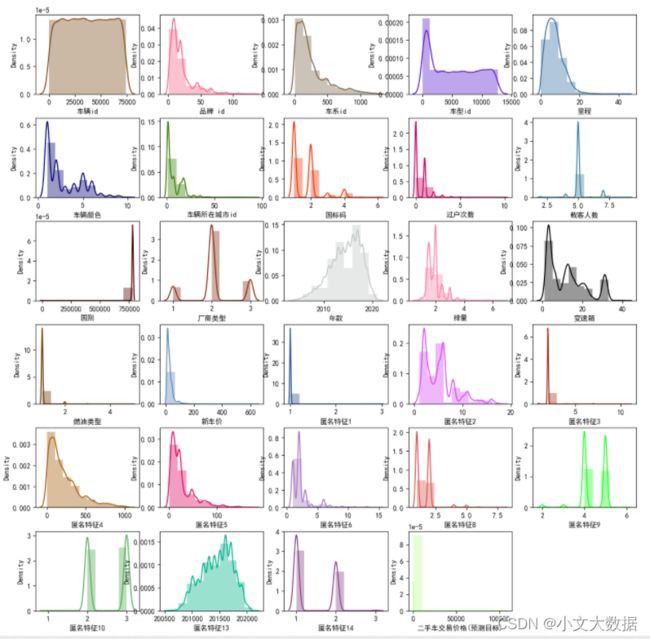
用于其他数据集效果展示:
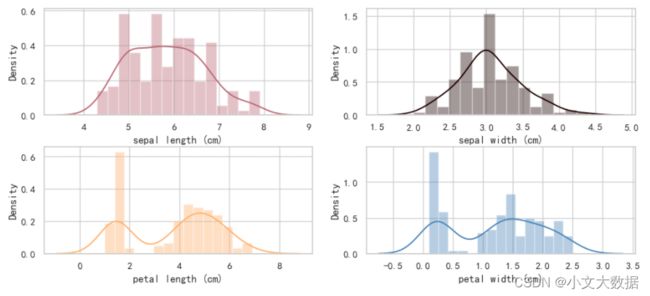
2、特征分布图:快速对数值型数据进行直方图、密度图绘制并分析其特征分布情况
参数:
bins:指定直方图直方数
kind:指定绘图类型,默认直方图,可选:hist(直方图)、kde(密度图)、both(直方与密度,在同时指定hue时会报错)
alpht:图像透明度
shade:密度图面积填充
# stat = "count", "frequency", "density", "probability"
def distplot(data, rows = 3, cols = 4, bins = 10, vars = None, hue = None, kind = 'hist',stat = 'count', shade = True,
             figsize = (12, 5), color_style = 'all', alpha = 0.7, subplots_adjust = (0.3, 0.2)):
    assert kind in ['hist', 'kde','both'], "kind must == 'hist' or 'kde'"
    assert stat in ["count", "frequency", "density", "probability"], 'stat must in ["count", "frequency", "density", "probability"]'


    fig = plt.figure(figsize = figsize)
    hue_name = hue  if isinstance(hue,str) or hue==None else hue.name
    hue = data[hue] if isinstance(hue,str) and hue in data.columns else hue
    data = data if not vars else data[vars]

    colors = get_colors(color_style)

    ax_num = 1
    for col in data.columns:
        if isinstance(data[col].values[0],(np.int64,np.int32,np.int16,np.int8,np.float16,np.float32,np.float64)) and col!=hue_name:
            plt.subplot(rows, cols, ax_num)
            if kind == 'hist':
                sns.histplot(x = data.loc[:,col],bins = bins,color=random.sample(colors,1)[0],hue = hue,alpha = alpha,stat = stat)
            elif kind == 'kde':
                sns.kdeplot(x = data.loc[:,col],color=random.sample(colors,1)[0],alpha = alpha,hue = hue,fill = shade)
            else:
                sns.distplot(x = data.loc[:,col],color=random.sample(colors,1)[0],kde=True,bins = bins,)
                plt.xlabel(col)
            ax_num+=1

    plt.subplots_adjust(hspace = subplots_adjust[0],wspace=subplots_adjust[1])
使用展示:
# 直方图
distplot(data,1,4,color_style='all',bins = 9)
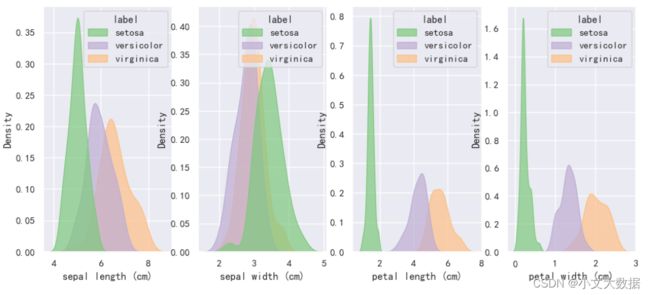
使用hue参数对每个特征细分类别 :
distplot(data,2,2,color_style='all',hue='label')with sns.axes_style('dark'):
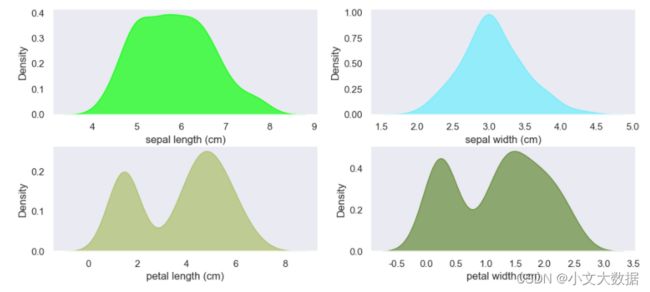
# 密度图
distplot(data,2,2,kind = 'kde',color_style='all',shade = True)使用hue参数对每个特征细分类别 :
with sns.color_palette('Accent'):
    distplot(data,2,2,kind = 'kde',color_style='dark',hue = 'label')
distplot(data,2,2,color_style='all',kind = 'both',bins = 15)快速用于其他数据效果展示:
二、数值特征估计图:柱状图
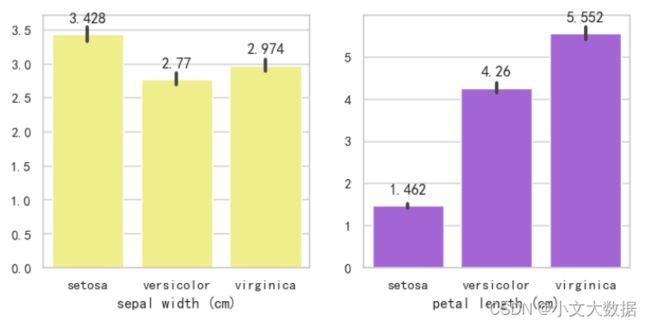
(参考sns.barplot)快速对数值型数据根据特定估计函数进行绘制柱状图。
参数:
estimator:估计聚合函数,如np.mean。
show_value:是否展示数值
def barplot(data, rows = 3, cols = 4, hue = None, estimator = np.mean, show_value = False,figsize = (13, 8), vars  =None,
            color_style ='light',subplots_adjust = (0.2, 0.2)):

    fig = plt.figure(figsize = figsize)
    hue = data[hue] if isinstance(hue,str) and hue in data.columns else hue
    data = data if not vars else data[vars]

    colors = get_colors(color_style)
    ax_num = 1
    for col in data.columns:
        if isinstance(data[col].values[0],(np.int64,np.int32,np.int16,np.float16,np.float32,np.float64)):
            plt.subplot(rows, cols, ax_num)
            AxesSubplot = sns.barplot(x = hue, y= data[col].values,color=random.sample(colors,1)[0],data = data,estimator = estimator)
            plt.xlabel(col)
            if show_value:
                # 标注y轴数值
                for container in AxesSubplot.containers:
                    plt.bar_label(container,padding=8)
            ax_num+=1


    plt.subplots_adjust(hspace = subplots_adjust[0],wspace=subplots_adjust[1])
使用展示:
barplot(data,2,3,hue= 'label',estimator=np.mean,show_value=True,vars = data.columns[1:3].tolist())三、离散特征统计图:柱状图、饼图
对离散型特征快速统计离散类别数进行可视化。
离散特征使用数据展示(数据来源于2022全国数学建模C题):
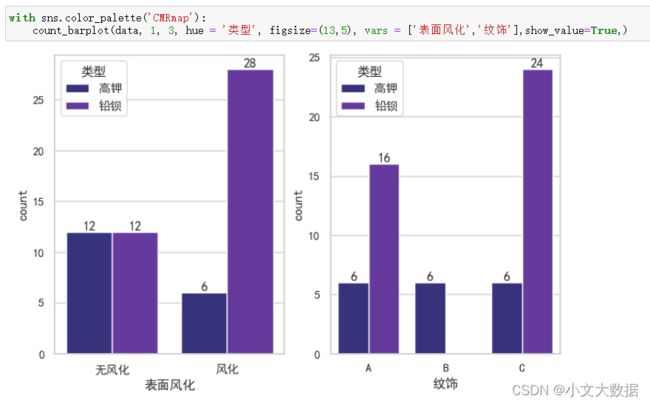
1、柱状图:
参数:
orient:指定柱状‘v’垂直或‘h’水平。
sort_by:指定按照‘index’或‘value’排序。
ascending: 默认False降序排序,True为升序。
top:int,指定给出top几数据,可配合sort_by、ascending使用取出统计量最高top几的数据。
def count_barplot(data, rows = 3, cols = 4, hue =None, vars = None, show_value = False,sort_by = 'index',
             orient='v', top = None, ascending = False, figsize = (10, 8), subplots_adjust = (0.2,0.2)):
    fig = plt.figure(figsize = figsize)

    hue_name = hue if isinstance(hue,str) or hue==None else hue.name # 取出分类特征名
    hue = data[hue] if isinstance(hue,str) and hue in data.columns else hue # 单独取出分类特征
    data = data if not vars else data[vars] # 部分特征

    ax_num = 1
    for col in data.columns:
        if isinstance(data[col].values[0], str) and col!=hue_name:
            plt.subplot(rows, cols, ax_num)
            # 排序
            d = data[col].value_counts().sort_values(ascending = ascending) if sort_by =='values' else \
                                                        data[col].value_counts().sort_index()
            order =d.index.tolist()[:top] # 取出前几
            # 垂直或水平
            if orient == 'v':
                AxesSubplot = sns.countplot(x = col, data = data , hue = hue, order = order,)
            elif orient == 'h':
                AxesSubplot = sns.countplot(y = col, data = data , hue = hue, order = order,)

            # 若由于top而未展示全部数据,则给出top几的标题说明
            if top:
                ax = plt.gca()
                ax.set_title(f'Top {len(order)}') if len(d.index)>top else None

            # 标注y轴数值
            if show_value:
                for container in AxesSubplot.containers:
                    plt.bar_label(container)
            ax_num+=1

    plt.subplots_adjust(hspace = subplots_adjust[0],wspace=subplots_adjust[1])
使用展示:
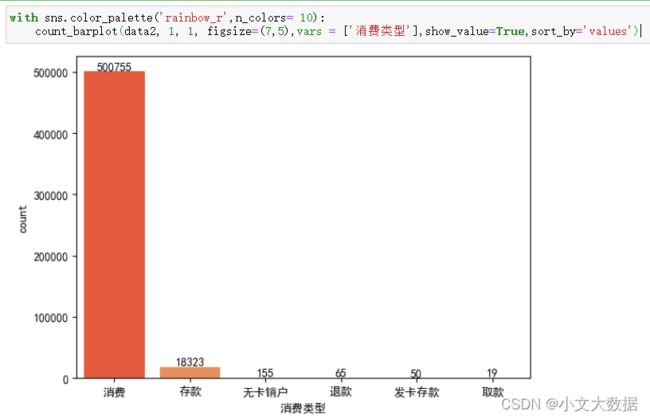
用于其他数据效果展示:
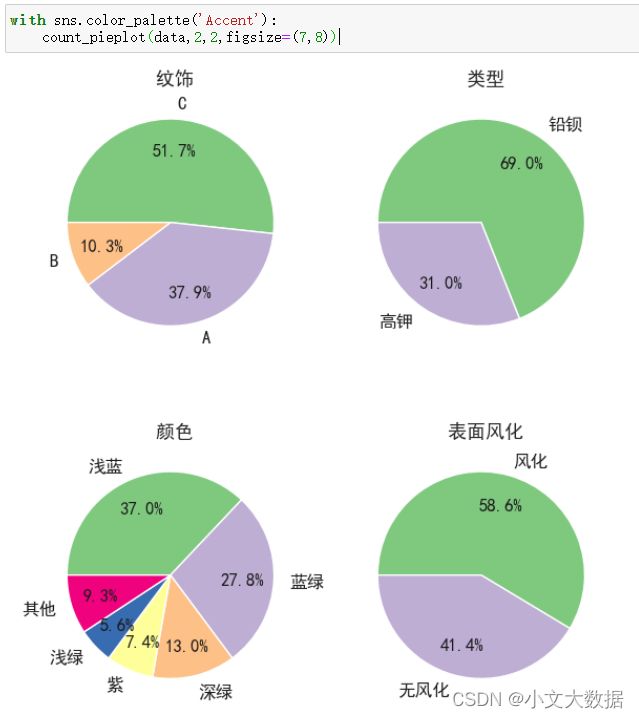
2、饼图:
参数:
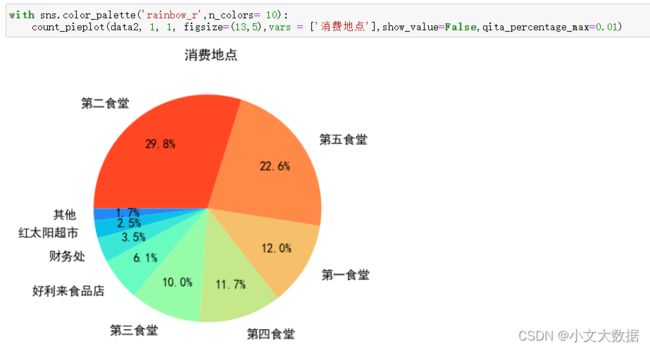
qita_percentage_max:小于指定百分比的类别均划分为‘其他’一类。
def count_pieplot(data, rows =None, cols = None, hue =None, vars = None, show_value =False, qita_percentage_max = 0.0,
            figsize = (12,8), color_style=None,subplots_adjust = (0.2,0.2)):
    hue_name = hue  if isinstance(hue,str) or hue==None else hue.name
    hue = data[hue] if isinstance(hue,str) and hue in data.columns else hue

    labels = pd.unique(data[hue_name]).tolist() if hue_name !=None else []      # 获取类别
    labels.remove(np.nan) if np.nan in labels else None  # 去除nan值
    data = data if not vars else data[vars]

    if rows and cols:
        pie_rows = rows
        pie_cols = cols
    elif labels !=None:
        pie_rows = len(labels) if len(labels)!=0 else 1  # 子图行数
        pie_cols = sum(list(map(lambda x:isinstance(x, str),data.iloc[0, data.columns!=hue_name])))  # 子图列数
    labels.append('') if labels==[] else None

    fig, axes = plt.subplots(pie_rows, pie_cols, figsize = figsize)

    ax = axes.ravel() if (pie_rows != 1) or (pie_cols !=1 ) else [axes]
    colors = None if not color_style else np.random.choice(get_colors(color_style),10)

    ax_num = 0
    for label in labels:
        data_ = data[hue==label] if label!='' else data  # 取出一个类别的数据
        # 对该类别数据每个特征进行统计
        for col in data.columns:
            if isinstance(data[col].values[0], str) and col!=hue_name:
                d = data_[col].value_counts()
                d = qita(d,qita_percentage_max = qita_percentage_max)
                bingtu(d.index, d.values, ax[ax_num], colors,  show_value = show_value)
#                 ax.pie(d.values, labels = d.values)
                ax[ax_num].set_title(label+' '+col, fontsize = 13)
                ax_num+=1

    plt.subplots_adjust(hspace = subplots_adjust[0],wspace=subplots_adjust[1])

def bingtu(label,shuju,ax,colors = None, show_value = False):
    def make_autopct(values):
        def my_autopct(pct):
            total = sum(values)
            val = int(round(pct*total/100.0))
            # 同时显示数值和占比的饼图
            return '{p:.1f}%\n{v:d}'.format(p=pct,v=val)
        return my_autopct
    ax.pie(x = shuju,         # 绘图数据
            explode = None,       # 突出显示特定人群
            labels=label,         # 添加教育水平标签
            colors=colors,         # 设置饼图的自定义填充色
            autopct=make_autopct(shuju) if show_value else '%.1f%%',      # 设置百分比的格式,这里保留一位小数
            pctdistance=0.7,       # 设置百分比标签与圆心的距离
            labeldistance = 1.15,  # 设置教育水平标签与圆心的距离
            startangle = 180,      # 设置饼图的初始角度
            radius = 1,          # 设置饼图的半径
            counterclock = False, # 是否逆时针,这里设置为顺时针方向
            # 设置饼图内外边界的属性值:linewidth表示饼图内外边框线宽度;width表示饼图内外宽度,可控制生成环形图;edgecolor表示边框线的颜色
            textprops = {'fontsize':12, 'color':'k'},   # 设置文本标签的属性值
            center = (0,0),        # 设置饼图的原点
            frame = 0)

def qita(series_counts, qita_percentage_max = 0.05):
    qita_sum = 0
    for index, value in zip(series_counts.index, series_counts):
        if value/sum(series_counts) < qita_percentage_max:
            qita_sum += value
            series_counts.drop(index,inplace = True)
    if qita_sum != 0:
        series_counts = pd.concat((series_counts,pd.Series({'其他':qita_sum})))
    return series_counts
使用展示:
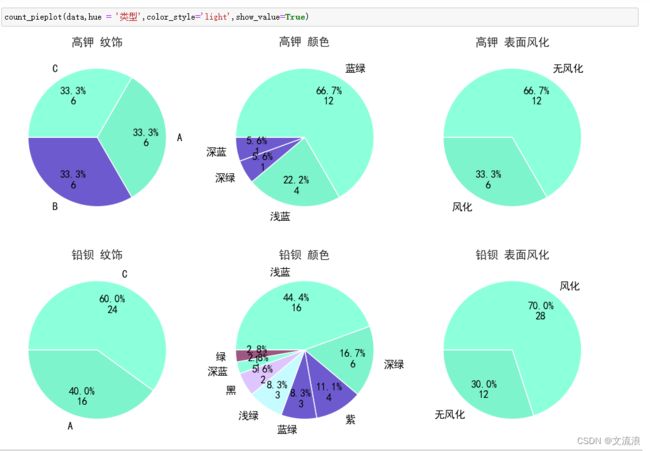
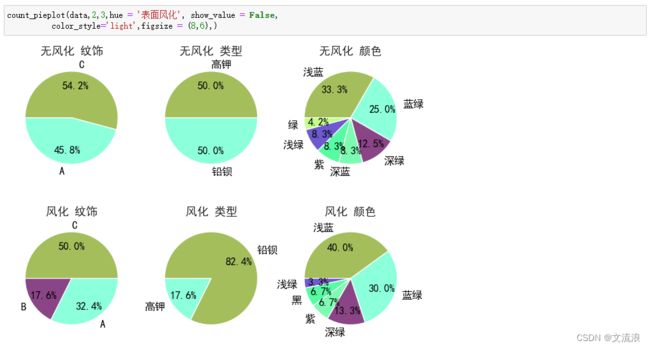
使用hue时,若rows/cols未指定,将自动指定rows为hue指定特征的类别数,cols为离散特征数。
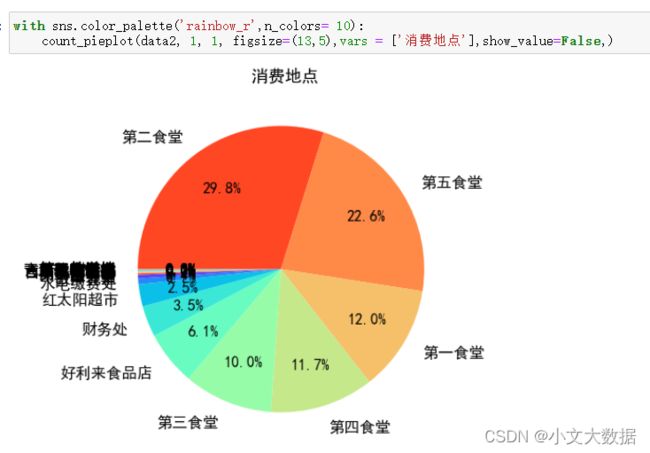
用于其他数据展示qita_percentage_max参数的功能效果:
如上:使用默认值时,展示所有数据,会导致很多很小数量的数据堆在一起导致可视化效果很不理想,可通过 qita_percentage_max将这些都划分为其他类别,效果如下。
