机器学习实战(1):分类
机器学习实战(1)分类
参考书籍:Hands-On Machine Learning with Scikit-Learn and TensorFlow: Concepts, Tools, and Techniques to Build Intelligent Systems, Second Edition
编译器:jupyter notebook
3.1 MNIST
MNIST数据集是一组数字图片,相当于机器学习的“hello world”,其下载内容是一个类字典结构
下载数据集
from sklearn.datasets import fetch_openml
mnist = fetch_openml('mnist_784',version=1)
mnist.keys()
输出内容:
dict_keys(['data', 'target', 'frame', 'categories', 'feature_names', 'target_names', 'DESCR', 'details', 'url'])
看一下下载数据的数组大小(.shape)
其中 X为特征数据,y为类别标签
X, y = mnist["data"], mnist["target"]
X.shape
(70000, 784)
y.shape
(70000,)
数据中共有7000张图片,我们可以用Matplotlib()的imshow()函数将其显示出来:
import matplotlib as mpl
import matplotlib.pyplot as plt

some_digit = X[0]
some_digit_image = some_digit.reshape(28, 28)

plt.imshow(some_digit_image, cmap="binary")
plt.axis("off")
plt.show()
plt(matplotlib.pyplot)是python中的绘图工具
这看起来就是数字5,而标签告诉我们没错:
y[0]
'5'
这个标签用字符格式储存,而我们的算法希望他是数字:
#将字符转换成数字
import numpy as np
y = y.astype(np.uint8)
我们将前60000张图片作为训练集,后10000张图片作为测试集
#前60000是数据集,后10000是测试集
X_train, X_test, y_train, y_test = X[:60000], X[60000:], y[:60000], y[60000:]
3.2 训练二级分类器
我们先从一个简单的识别单一数字做起:这个数字 是5/不是5
我们先将y标签改变(是5记为1,不是记为0)
y_train_5 = (y_train == 5)
y_test_5 = (y_test == 5)
接着挑选一个分类器并开始训练: 随机梯度下降(SGD)分类器
from sklearn.linear_model import SGDClassifier

sgd_clf = SGDClassifier(random_state=42)
sgd_clf.fit(X_train, y_train_5)
说明:
1.sgd_clf储存的是我们用的训练方法,用 .fit(输入数据, 标签) 来进行样本训练
2.SGDClassfier本是随机训练,random_state是一个参数保证每次训练结果相同,42是一个幸运数字而已
我们用它来检验数字5的图片
(如果你的记忆力好,应该可以记得some_digit储存的是X[0]这个数据)
sgd_clf.predict([some_digit])
输出:
array([True])
3.3 性能测量
3.3.1 使用交叉验证测量准确率
K-折交叉验证:将k份数据中的 k-1个用来预测,1个用来训练
本次我们用三个折叠进行预测
from sklearn.model_selection import cross_val_score
cross_val_score(sgd_clf, X_train, y_train_5, cv=3, scoring="accuracy")
输出(每一个交叉验证的准确率):
array([0.95035, 0.96035, 0.9604 ])
看似很高的分类准确率,但其实却很低
假设我们有一个分类器,将每张图片都看成:非5
事实表明它的准确率也会超过90%
3.3.2 混淆矩阵
评估分类器性能的更好方法是混淆矩阵,混淆矩阵会记录A类别示例被分成B类别示例的次数,记录在第A行第B列中。
为了不污染数据,我们先抛弃之前所应用的方法,用新的方法来验证训练集
#cross_val_predict: 一种直接的K-折交叉验证,返回每个折叠的预测
from sklearn.model_selection import cross_val_predict
y_train_pred = cross_val_predict(sgd_clf, X_train, y_train_5, cv=3)
#获取混淆矩阵
from sklearn.metrics import confusion_matrix
confusion_matrix(y_train_5, y_train_pred)
输出:
array([[53892,   687],
       [ 1891,  3530]], dtype=int64)
这表示,其中有53892张被正确的分为“非5”类别(True Negative),有687张被错误的分成了“5”(False Positive),有1891张被错误的分成了“非5”(False Negative),有3530张被正确的分为了“5”(True Positive)。
混淆矩阵能提供大量信息,但是有时你希望指标更简洁一点:
3.3.3 精度 TP/(TP+FP)
from sklearn.metrics import precision_score, recall_score
precision_score(y_train_5, y_train_pred)
输出:
0.8370879772350012
3.3.4 召回率 TP/(TP+FN)
recall_score(y_train_5, y_train_pred)
输出:
0.6511713705958311
3.3.5 F1分数
F1分数:一个将精度和召回率结合的指标
F1=2/(1/精度+1/召回率)
#F1分数
from sklearn.metrics import f1_score
f1_score(y_train_5, y_train_pred)
输出:
0.7325171197343846
3.3.6 召回率和精度权衡
我们先来看看SGDClassifier如何进行分类决策:
对于每个实例,他会基于决策函数计算出一个分值,如果该值大于阈值,则为正类。
阈值越高,召回率越低,(通常)精度越高
比如我们先观察一下X[0]的决策分数
# decision_fuction函数返回某个数据的决策分数
y_scores = sgd_clf.decision_function([some_digit])
y_scores
# 输出:array([2164.22030239])
而我们对阈值的调整,会影响预测结果
threshold = 0
y_some_digit_pred = (y_scores > threshold)
y_some_digit_pred
#输出:array([ True])
threshold = 8000
y_some_digit_pred = (y_scores > threshold)
y_some_digit_pred
#输出:array([ False])
我们现要通过cross_val_predict()获得所有数据的决策分数
y_scores = cross_val_predict(sgd_clf, X_train, y_train_5, cv=3,
                            method="decision_function")

y_scores
#输出:array([  1200.93051237, -26883.79202424, -33072.03475406, ..., 13272.12718981,  -7258.47203373, -16877.50840447])
通过这些决策分数,计算每种可能的阈值的精度和召回率是多少
#计算所有可能的阈值的精度和召回率
from sklearn.metrics import precision_recall_curve
precisions, recalls, thresholds = precision_recall_curve(y_train_5, y_scores)
#用画布画出图像
def plot_precision_recall_vs_threshold(precisions, recalls, thresholds):
    plt.plot(thresholds,precisions[:-1], "b--", label="Precision")
    plt.plot(thresholds, recalls[:-1], "g--", label="Recall")

plot_precision_recall_vs_threshold(precisions, recalls, thresholds)
plt.show()
输出:

书中图片并没有后半段的折线,但出现这样的情况应可以理解
我们找到精度>=90%的第一个阈值索引
#返回精度>=90%的第一个阈值索引
threshold_90_precision = thresholds[np.argmax(precisions >= 0.90)]

threshold_90_precision
#输出:3370.0194991439557
用这个阈值来进行二分类,并计算出这样分类的精度和召回率
y_train_pred_90 = (y_scores >= threshold_90_precision)
#精度
precision_score(y_train_5, y_train_pred_90)
#输出 0.9000345901072293
#召回率
recall_score(y_train_5, y_train_pred_90)
#输出 0.4799852425751706
那你现在已经有一个90%精度的分类器了。
3.3.7 ROC曲线
ROC曲线的y轴为召回率,x轴为假正率
from sklearn.metrics import roc_curve
fpr, tpr, thresholds = roc_curve(y_train_5, y_scores)

def plot_roc_curve(fpr, tpr, label=None):
    plt.plot(fpr, tpr, linewidth=2, label=label)
    plt.plot([0, 1],[0, 1], 'k--')

plot_roc_curve(fpr, tpr)
plt.show()
ROC的面积的大小(曲线包含的右下角面积)代表了分类器的好坏,用ROC AUC来表示
#计算ROC曲线下面积(AUG)
from sklearn.metrics import roc_auc_score
roc_auc_score(y_train_5, y_scores)
#输出 0.9604938554008616
现在我们来用一个新的方法(随机森林),来比较两者的ROC AUC
#新方法:随机森林
from sklearn.ensemble import RandomForestClassifier

forest_clf = RandomForestClassifier(random_state=42)
y_probas_forest = cross_val_predict(forest_clf, X_train, y_train_5, cv=3,
                                    method="predict_proba")
y_scores_forest = y_probas_forest[:,1]
fpr_forest, tpr_forest, thresholds_forest = roc_curve(y_train_5, y_scores_forest)
plt.plot(fpr, tpr, "b:", label="SGD")
plot_roc_curve(fpr_forest, tpr_forest, "Random Forest")
plt.legend(loc="lower right")
plt.show()
roc_auc_score(y_train_5, y_scores_forest)
#输出:0.9983436731328145
3.4 多类分类器
创建一个系统将数字照片分为10类,有两种方法:
1.OvR策略:用10个二元分类器:0-检测器,1-检测器…9-检测器
2.OvO策略:每两个数字创建一个二元分类器(45个):区分0和1,区分0和2,区分1和2,以此类推
我们在这里超前使用第五章的SVM分类器(OvR策略)
from sklearn.svm import SVC
svm_clf = SVC()
svm_clf.fit(X_train, y_train)
svm_clf.predict([some_digit])
输出:
array([5], dtype=uint8)
检测some_digit在每一个二元分类器中获得的分数
some_digit_scores = svm_clf.decision_function([some_digit])
some_digit_scores
输出:
array([[ 1.72501977,  2.72809088,  7.2510018 ,  8.3076379 , -0.31087254,
         9.3132482 ,  1.70975103,  2.76765202,  6.23049537,  4.84771048]])
可见,它最大的可能的数字是5
SGD分类器可以直接将实例分为多个类,不用采用OvR或者OvO方式
sgd_clf.fit(X_train, y_train)
sgd_clf.predict([some_digit])
调用decision_fuction()就可以将SGD分类器每个实例分类的为每个类概率列表
sgd_clf.decision_function([some_digit])
输出:
array([[-31893.03095419, -34419.69069632,  -9530.63950739,
          1823.73154031, -22320.14822878,  -1385.80478895,
        -26188.91070951, -16147.51323997,  -4604.35491274,
        -12050.767298  ]])
交叉验证来评估SGD
cross_val_score(sgd_clf, X_train, y_train, cv=3, scoring="accuracy")
#输出:array([0.87365, 0.85835, 0.8689 ])
将输入进行简单缩放,可以提高准确率
#缩放
from sklearn.preprocessing import StandardScaler
scaler = StandardScaler()
X_train_scaled = scaler.fit_transform(X_train.astype(np.float64))
cross_val_score(sgd_clf, X_train_scaled, y_train, cv=3, scoring="accuracy")
array([0.8983, 0.891 , 0.9018])
3.5 误差分析
#混淆矩阵
y_train_pred = cross_val_predict(sgd_clf, X_train_scaled, y_train, cv=3)
conf_mx = confusion_matrix(y_train, y_train_pred)
conf_mx
array([[5577,    0,   22,    5,    8,   43,   36,    6,  225,    1],
       [   0, 6400,   37,   24,    4,   44,    4,    7,  212,   10],
       [  27,   27, 5220,   92,   73,   27,   67,   36,  378,   11],
       [  22,   17,  117, 5227,    2,  203,   27,   40,  403,   73],
       [  12,   14,   41,    9, 5182,   12,   34,   27,  347,  164],
       [  27,   15,   30,  168,   53, 4444,   75,   14,  535,   60],
       [  30,   15,   42,    3,   44,   97, 5552,    3,  131,    1],
       [  21,   10,   51,   30,   49,   12,    3, 5684,  195,  210],
       [  17,   63,   48,   86,    3,  126,   25,   10, 5429,   44],
       [  25,   18,   30,   64,  118,   36,    1,  179,  371, 5107]],
      dtype=int64)
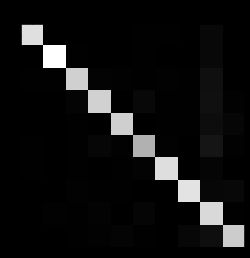
用画布显示
plt.matshow(conf_mx,cmap=plt.cm.gray)
plt.show()
但是我们需要关注错误,要将矩阵中每个值除以相应类中图片数量,比较错误率
row_sums = conf_mx.sum(axis=1, keepdims=True)
norm_conf_mx = conf_mx / row_sums
并用0填充对角线
np.fill_diagonal(norm_conf_mx, 0)
plt.matshow(norm_conf_mx, cmap=plt.cm.gray)
plt.show()


