Python数据科学库04(pandas)
Python数据科学库04(pandas)
学习04
numpy能够帮助我们处理数值,但是pandas除了处理数值之外(基于numpy),还能够帮助我们处理其他类型的数据。
pandas is an open source, BSD-licensed library providing high-performance, easy-to-use data structures and data analysis tools for the Python programming language.
pandas的常用数据类型
1、Series 一维,带标签数组
2、DataFrame 二维,Series容器
pandas之Series创建
Series 一维,带标签数组(标签指索引)

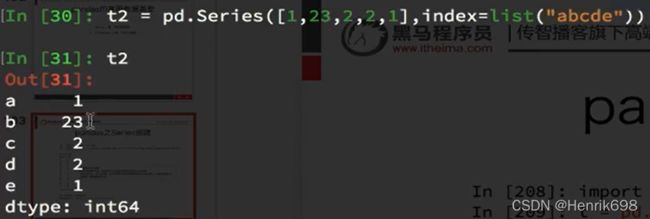
指定索引的Series**:**
![]()

![]()
通过字典创建一个Series,注意其中的索引就是字典的键。


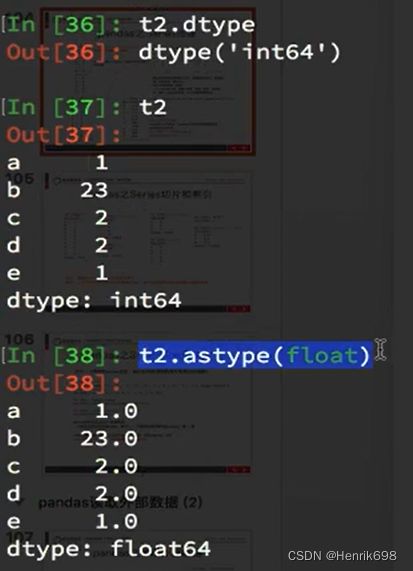
更改数据类型:
pandas之Series切片和索引

取单一数值:
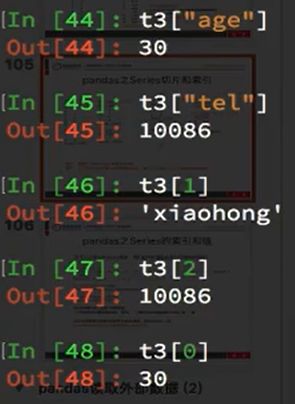

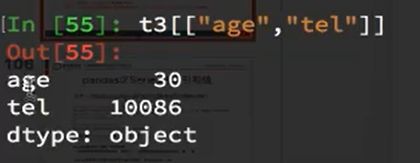
取连续数值:

强行取值:

结果为nan:

布尔索引取值:

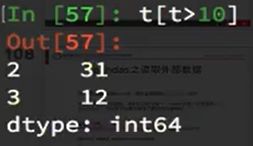
**对于一个陌生的series类型,我们如何知道他的索引和具体的值呢?
**


取index的值,转成列表:

取values值:

pandas之读取外部数据
现在假设我们有一个组关于狗的名字的统计数据,那么为了观察这组数据的情况,我们应该怎么做呢?
数据来源:https://www.kaggle.com/new-york-city/nyc-dog-names/data

读取结果:

我们的这组数据存在csv中,我们直接使用pd. read_csv即可
和我们想象的有些差别,我们以为他会是一个Series类型,但是他是一个DataFrame,那么接下来我们就来了解这种数据类型
但是,还有一个问题:
对于数据库比如mysql或者mongodb中数据我们如何使用呢?
pd.read_sql(sql_sentence,connection)
pandas之DataFrame
DataFrame 二维,Series容器
创建一个DataFrame

DataFrame对象既有行索引,又有列索引
行索引,表明不同行,横向索引,叫index,0轴,axis=0
列索引,表名不同列,纵向索引,叫columns,1轴,axis=1
DataFrame能够传入字典作为数据:
DataFrame能够传入mongodb作为数据:
那么mongodb的数据是不是也可以这样传入呢?可以

整理数据

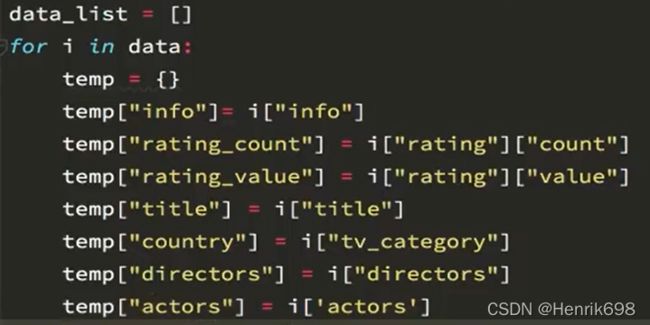

pandas之DataFrame的基础属性
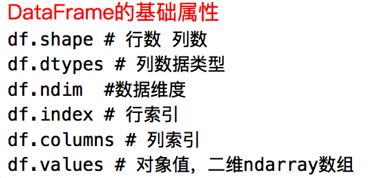
基础属性的实例:

查看index、columns、values:

查看shape,数据values有几行几列:

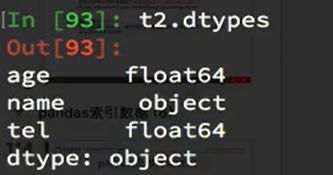
查看dtypes,即查看每组数据的类型:
查看数据的维度:
![]()
pandas之DataFrame整体情况查询

练习:
那么回到之前我们读取的狗名字统计的数据上,我们尝试一下刚刚的方法。
那么问题来了:
很多同学肯定想知道使用次数最高的前几个名字是什么呢?
df.sort_values(by=“Count_AnimalName”,ascending=False)


查看描述和信息:
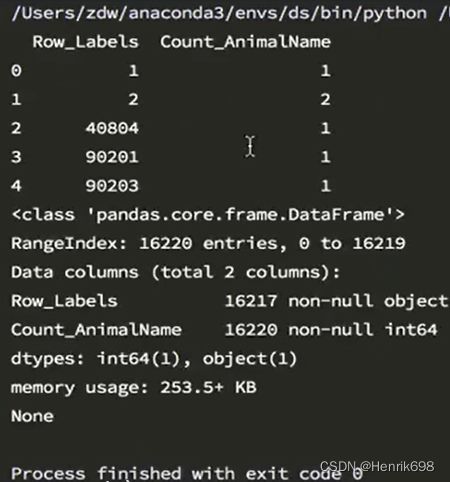
排序:(df.sort_values(by=“Count_AnimalName”,ascending=False)
)

显示后10个:
![]()
降序排列:ascending=False

取前5个:
![]()

那么问题又来了:
如果我的数据有10列,我想按照其中的第1,第3,第8列排序,怎么办?(看ipythpn的帮助文档),这里涉及到pandas的切片,下面的内容会有所涉及。
pandas之取行或者列


只取了一列的话,类型为Series类型,如果取两列或者多列,就是DataFrame类型。
pandas之loc、iloc
还有更多的经过pandas优化过的选择方式:
1、df.loc 通过标签索引行数据
2、df.iloc 通过位置获取行数据
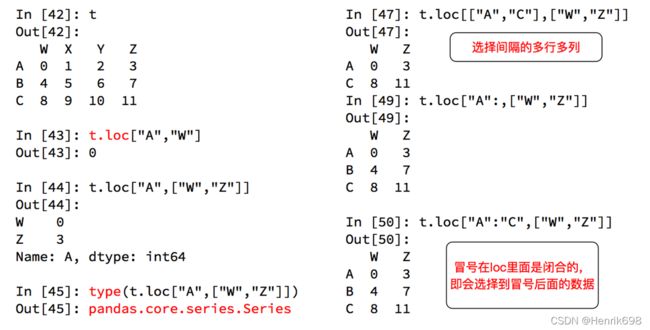
df.loc通过标签索引行数据

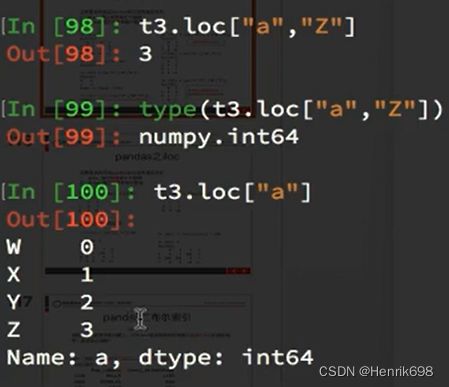
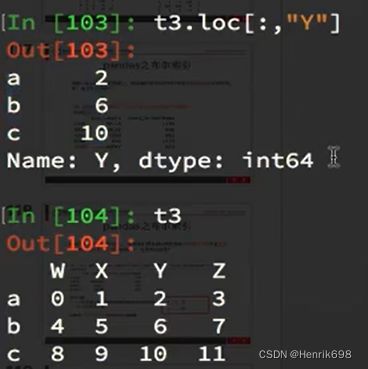
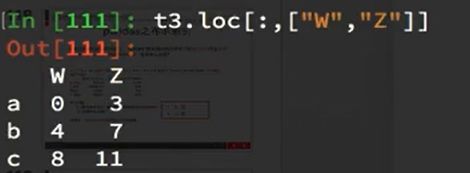
取多行或多列:


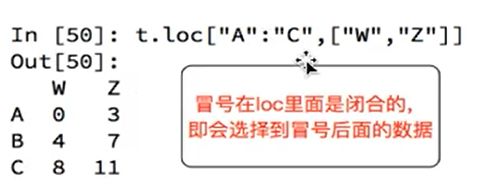
注意:
冒号在loc里面是闭合的,即会选择到冒号后面的数据。
如下图中"C", "C"这行有选中。
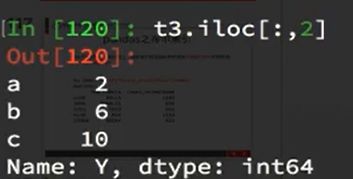
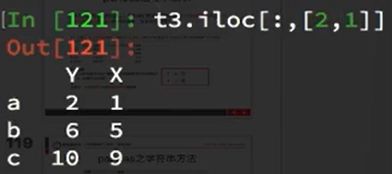
df.iloc通过位置获取行数据
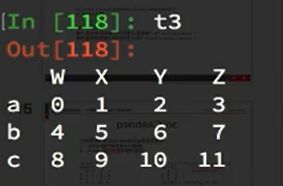
取行:

取列:
取不连续的多列:

连续多行多列:
![]()
赋值:
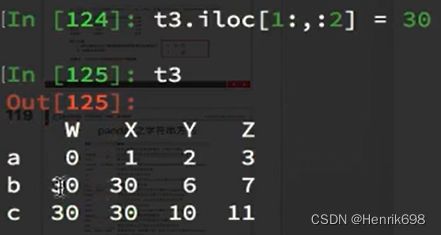
赋值nan:
np.nan是float类型,之前这样赋值是会报错的,但是在DataFrame中会自动将类型错误转换的。

pandas之布尔索引
回到之前狗的名字的问题上,假如我们想找到所有的使用次数超过800的狗的名字,应该怎么选择?

回到之前狗的名字的问题上,假如我们想找到所有的使用次数超过700并且名字的字符串的长度大于4的狗的名字,应该怎么选择?
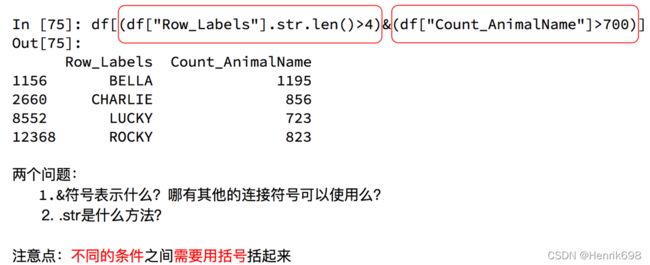
例子:


pandas之字符串方法
缺失数据的处理
我们的数据缺失通常有两种情况:
一种就是空,None等,在pandas是NaN(和np.nan一样)
另一种是我们让其为0,蓝色框中

对于NaN的数据,在numpy中我们是如何处理的?
在pandas中我们处理起来非常容易
判断数据是否为NaN:pd.isnull(df),pd.notnull(df)
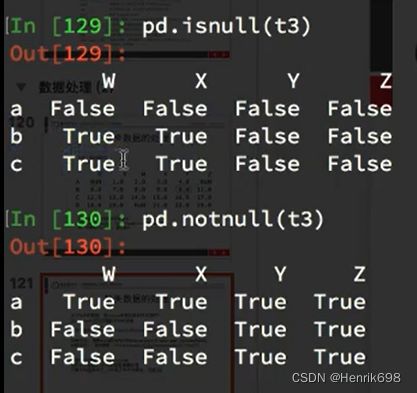
选择为True的那一行:

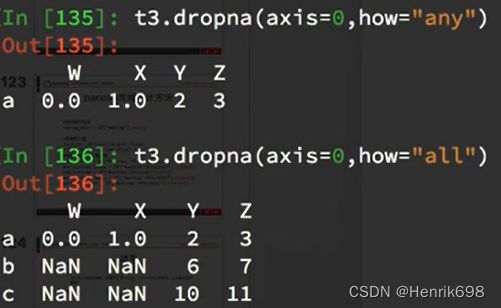
处理方式1:删除NaN所在的行列dropna (axis=0, how=‘any’, inplace=False)
(how=“all”表示某一行中全为nan才能进行删除,how默认为“any”表示只要这一行中有一个为nan就删除这一行;inplace=True表示原地替换,即替换原本的数据,对原本的数据进行修改。)

处理方式2:填充数据,t.fillna(t.mean()), t.fillna(t.median()), t.fillna(0)

nan处填入均值:

只操作具体的某一列:
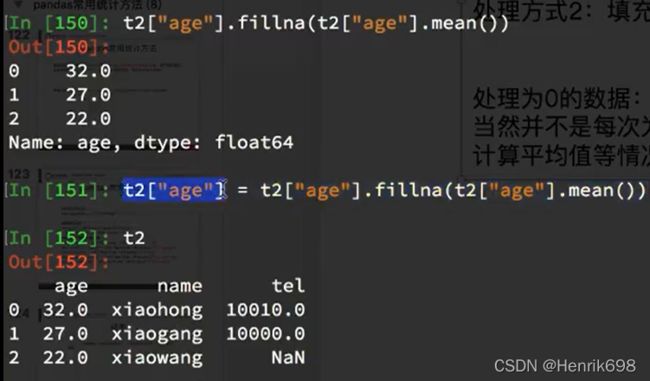
numpy中,有nan的列计算均值,结果为nan,而pandas中计算有nan的列时,是不将nan带入进行计算的。
例子:

处理为0的数据:t[t==0]=np.nan,可以让原本0处不参与计算的。
当然并不是每次为0的数据都需要处理
计算平均值等情况,nan是不参与计算的,但是0会
pandas常用统计方法
假设现在我们有一组从2006年到2016年1000部最流行的电影数据,我们想知道这些电影数据中评分的平均分,导演的人数等信息,我们应该怎么获取?
数据来源:https://www.kaggle.com/damianpanek/sunday-eda/data

答:
import pandas as pd
file_path= r’D:\whole_development_of_the_stack_study\RS_Algorithm_Course\为其1年的CV课程\03机器学习-数据科学库\14100_机器学习-数据科学库(HM)\数据分析资料\day04\code\IMDB-Movie-Data.csv’
df= pd.read_csv(file_path)
#print(df.info())
print(df.head(1))
#获取平均分
print(df[“Rating”].mean())
#导演的人数
print(len(set(df[“Director”].tolist())))
#或者:
print(len(df[‘Director’].unique()))
#获取演员的人数
temp_actors_list = df[“Actors”].str.split(",").tolist()
print(‘获取演员的人名:’,temp_actors_list)
#方法:通过循环将演员名平摊到一个列表中
actors_list1 = [i for j in temp_actors_list for i in j ]
actors_num1 = len(set(actors_list1))
print(actors_num1)
重要练习***:
01、对于这一组电影数据,如果我们想rating,runtime的分布情况,应该如何呈现数据?
runtime的直方图情况:
import numpy as np
from matplotlib import pyplot as plt
import pandas as pd
file_path= r’D:\whole_development_of_the_stack_study\RS_Algorithm_Course\为其1年的CV课程\03机器学习-数据科学库\14100_机器学习-数据科学库(HM)\数据分析资料\day04\code\IMDB-Movie-Data.csv’
df= pd.read_csv(file_path)
#print(df.info())
print(df.head(1))
runtime_data = df[“Runtime (Minutes)”].values
print(runtime_data)
print(type(runtime_data))
max_runtime = runtime_data.max()
min_runtime = runtime_data.min()
#计算组数
num_bin = int(((max_runtime - min_runtime)/0.5))
print(‘max_runtime:’,max_runtime)
print(‘min_runtime:’,min_runtime)
print(‘max_runtime - min_runtime:’,max_runtime - min_runtime)
print((max_runtime - min_runtime)/0.5)
print(‘num_bin:’,num_bin)
#设置图形的大小
plt.figure(figsize=(20,8),dpi = 80)
plt.hist(runtime_data,num_bin)
#控制x轴,以0.5为间隔显示
print(list(range(min_runtime,max_runtime)))
_x = list(range(min_runtime2,max_runtime2))
print(_x)
_x = [i/2 for i in _x]
print(_x)
#plt.xticks(range(min_runtime,max_runtime+0.5,0.5))
plt.xticks(_x[::5],rotation=45)
plt.show()
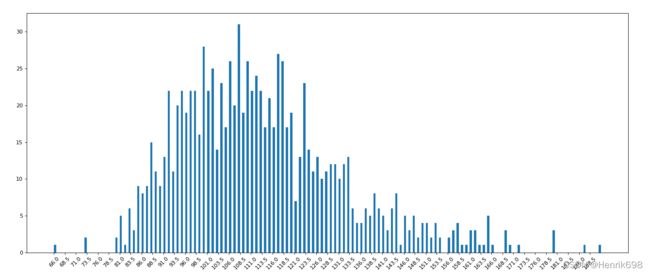
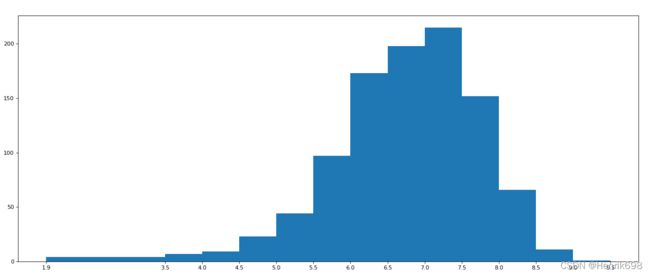
rating的直方图情况:
设置不等宽的组距,hist方法中取到的会是一个左闭右开的区间
import numpy as np
from matplotlib import pyplot as plt
import pandas as pd
file_path= r’D:\whole_development_of_the_stack_study\RS_Algorithm_Course\为其1年的CV课程\03机器学习-数据科学库\14100_机器学习-数据科学库(HM)\数据分析资料\day04\code\IMDB-Movie-Data.csv’
df= pd.read_csv(file_path)
#print(df.info())
#print(df.head(1))
runtime_data = df[“Rating”].values
#print(runtime_data)
#print(type(runtime_data))
max_runtime = runtime_data.max()
min_runtime = runtime_data.min()
#计算组数
print(‘max_runtime:’,max_runtime)
print(‘min_runtime:’,min_runtime)
#设置不等宽的组距,hist方法中取到的会是一个左闭右开的区间[1.9,3.5)
num_bin_list = [1.9,3.5]
i=3.5
while i<=max_runtime:
i+=0.5
num_bin_list.append(i)
print(num_bin_list)
#设置图形的大小
plt.figure(figsize=(20,8),dpi=80)
plt.hist(runtime_data,num_bin_list)
#_x = [min_runtime]
#i = min_runtime
#while i<=max_runtime+0.5:
#i = i+0.5
#_x.append(i)
#
plt.xticks(num_bin_list)
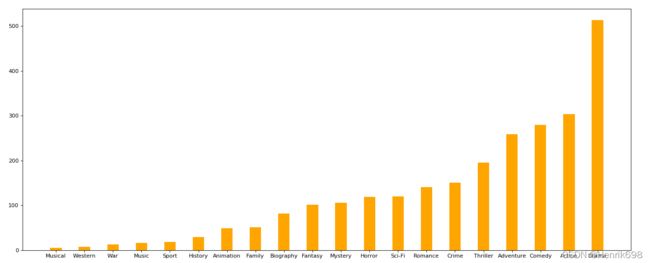
02、对于这一组电影数据,如果我们希望统计电影分类(genre)的情况,应该如何处理数据?
思路:重新构造一个全为0的数组,列名为分类,如果某一条数据中分类出现过,就让0变为1


import numpy as np
from matplotlib import pyplot as plt
import pandas as pd
file_path= r’D:\whole_development_of_the_stack_study\RS_Algorithm_Course\为其1年的CV课程\03机器学习-数据科学库\14100_机器学习-数据科学库(HM)\数据分析资料\day04\code\IMDB-Movie-Data.csv’
df= pd.read_csv(file_path)
#print(df.info())
print(df.head(1))
print(df[“Genre”].head(3))
print(’*’*100)
#重要的例子:统计每个分类的电影的数量和
#统计分类的列表
temp_list = df[“Genre”].str.split(",").tolist() #[[],[],[]]
print(‘temp_list:’,temp_list)
genre_list = list(set([i for j in temp_list for i in j]))
#构造全为0的数组
zeros_df = pd.DataFrame(np.zeros((df.shape[0],len(genre_list))),columns=genre_list)
print(zeros_df)
print(’*’*100)
#给每个电影出现分类的位置赋值1
for i in range(df.shape[0]):
# print(temp_list[i])
#zeros_df.loc[0,[“Sci-fi”,“Mucical”]] = 1
zeros_df.loc[i, temp_list[i]] = 1
print(zeros_df.head(3))
#统计每个分类的电影的数量和
genre_count = zeros_df.sum(axis=0)
print(genre_count)
#排序
genre_count = genre_count.sort_values()
_x = genre_count.index
_y = genre_count.values
#画图
plt.figure(figsize=(20,8),dpi=80)
plt.bar(range(len(_x)),_y, width=0.4, color = “orange”)
plt.xticks(range(len(_x)),_x)
plt.show()
