机器学习实战(一):Document clustering 文档聚类
机器学习实战(一):Document clustering 文档聚类
- 1. 简介
- 2.数据解析
- 3. 符号化和词根化
- 4. 词向量化
- 5.K means
- 6.绘图
1. 简介
文档聚类是指根据文档的文本和语义背景将其归入不同的组别。它是一种无监督的技术,因为我们没有文件的标签,它在信息检索和搜索引擎中得到了应用。
为了根据文档的内容进行分类,我决定使用K-手段算法。由于项目是没有标签的,这显然是一个无监督的学习问题,最好的解决方案之一应该是K-Means。当然,我们可以使用不同的算法,如高斯混合模型,甚至深度学习方法,如自动编码器。我将使用python与Jupyter笔记本,将代码和结果与文档结合起来。
我在Anaconda环境下开发代码,并使用了以下依赖:
Pandas库用于数据处理Sklearn库用于机器学习和预处理Matplotlib库用于绘图Ntlk库用于自然语言算法BeautifulSoup库用于从 xml 文件中解析文本并删除类别
2.数据解析
函数parseXML使用xml.etree.ElementTree来解析数据。我决定只使用项目的标题和描述来进行聚类,这与语义学最相关。由于描述不是原始文本,我们用BeautifulSoup库提取文本,我已经提到过。此外,我们还放弃了那些描述非常小的项目,因为它们影响了最终的聚类。我们可以认为它们都属于一个额外的聚类。当然,还有一些方法可以包括它们,但我暂时没有使用它们。
import xml.etree.ElementTree as ET
import pandas as pd

import nltk
from sklearn.cluster import KMeans
from sklearn.externals import joblib
from sklearn.feature_extraction.text import TfidfVectorizer
from sklearn.metrics.pairwise import cosine_similarity

nltk.download('punkt')
from bs4 import BeautifulSoup
from nltk import SnowballStemmer
import re

def parseXML(xmlfile):

    tree = ET.parse(xmlfile)
    root = tree.getroot()

    titles=[]
    descriptions=[]

    for item in root.findall('./channel/item'):

        for child in item:

            if(child.tag=='title' ):
                titles.append(child.text)

            if (child.tag == 'description' ):

                soup = BeautifulSoup(str(child.text).encode('utf8','ignore'), "lxml")
                strtext=soup.text.replace(u'\xa0', u' ').replace('\n',' ')

                descriptions.append(strtext)

    return titles,descriptions

#remove items with short descriptions
bef_titles,bef_descriptions = parseXML('data.source.rss-feeds.xml')
print('Count of items before dropping:' ,len(bef_titles))

titles=[]
descriptions=[]
for i in range(len(bef_titles)):

    if ( len(bef_descriptions[i]) > 500):
        titles.append(bef_titles[i])
        descriptions.append(bef_descriptions[i])

print('Count of items after:' ,len(titles))
[nltk_data] Downloading package punkt to
[nltk_data]     C:\Users\sergi\AppData\Roaming\nltk_data...
[nltk_data]   Package punkt is already up-to-date!
Count of items before dropping: 1662
Count of items after: 1130
3. 符号化和词根化
下一步是将文本标记为单词,删除任何形态词缀,并删除冠词和介词等常用词。这可以通过ntlk的内置功能来完成。最后,我们得到两个不同的词汇表(一个标记化和词干化,一个只有标记化),我们将它们合并到一个pandas数据框架中。
def tokenize_and_stem(text):

    #tokenize
    tokens = [word for sent in nltk.sent_tokenize(text) for word in nltk.word_tokenize(sent)]
    filtered_tokens = []

    #keep only letters
    for token in tokens:
        if re.search('[a-zA-Z]', token):
            filtered_tokens.append(token)
    #stemming
    stems = [stemmer.stem(t) for t in filtered_tokens]
    return stems


def tokenize_only(text):

    tokens = [word.lower() for sent in nltk.sent_tokenize(text) for word in nltk.word_tokenize(sent)]
    filtered_tokens = []

    for token in tokens:
        if re.search('[a-zA-Z]', token):
            filtered_tokens.append(token)
    return filtered_tokens
# nltk's English stopwords and stemmer
stemmer = SnowballStemmer("english")

#create steam and tokenized voucabularies
totalvocab_stemmed = []
totalvocab_tokenized = []

for i in descriptions:
    allwords_stemmed = tokenize_and_stem(i)
    totalvocab_stemmed.extend(allwords_stemmed)

    allwords_tokenized = tokenize_only(i)
    totalvocab_tokenized.extend(allwords_tokenized)

vocab_frame = pd.DataFrame({'words': totalvocab_tokenized}, index=totalvocab_stemmed)
print('there are ' + str(vocab_frame.shape[0]) + ' items in vocab_frame')
there are 481437 items in vocab_frame
4. 词向量化
在我们将数据加载到K-手段算法之前,必须对其进行向量化。最流行的技术是Tdidf向量器,它根据文档中的单词频率创建一个矩阵,这就是我们要使用的技术。值得一提的是,作为未来的工作,word2vec和doc2vec可能会更有效地表示项目之间的关系。
#Tf-idf


tfidf_vectorizer = TfidfVectorizer(max_df=0.8, max_features=200000,min_df=0.2, stop_words='english',
                                 use_idf=True, tokenizer=tokenize_and_stem, ngram_range=(1,3))

tfidf_matrix = tfidf_vectorizer.fit_transform(descriptions)
print('Td idf Matrix shape: ',tfidf_matrix.shape)

terms = tfidf_vectorizer.get_feature_names()

#calculate the distance matrix . I will use them in the visualization of the cluster.
dist = 1 - cosine_similarity(tfidf_matrix)
Td idf Matrix shape: (1130, 74)
5.K means
实际的聚类发生在这里,K means在Td-idf矩阵的基础上产生5个聚类。我们可以很容易地预测,这将不是一个最佳的解决方案,因为它只考虑到了文件中每个词的频率。
num_clusters = 5

km = KMeans(n_clusters=num_clusters)
km.fit(tfidf_matrix)

clusters = km.labels_.tolist()
为了展示集群,我创建了一个由集群索引的pandas Dataframe。每个聚类的前6个词呈现在下面。我们注意到,这个聚类远非完美,因为有些词在一个以上的聚类中。另外,集群的语义内容之间也没有明确的区别。我们可以很容易地看到,与工作有关的词汇包括在多个聚类中。
items = { 'title': titles, 'description': descriptions}

frame = pd.DataFrame(items, index = [clusters] , columns = [ 'title','cluster'])


print("Top terms per cluster:")

# sort cluster centers by proximity to centroid
order_centroids = km.cluster_centers_.argsort()[:, ::-1]

for i in range(num_clusters):
    print("Cluster %d words:" % i, end='')

    for ind in order_centroids[i, :6]:  # replace 6 with n words per cluster
        print(' %s' % vocab_frame.ix[terms[ind].split(' ')].values.tolist()[0][0], end=',')


    print()

    #print("Cluster %d titles:" % i, end='')
    #for title in frame.ix[i]['title'].values.tolist():
       #print(' %s,' % title, end='')
Top terms per cluster:
Cluster 0 words: labour, employability, european, social, work, eu,
Cluster 1 words: occupational, sectors, skill, employability, services, workers,
Cluster 2 words: skill, job, labour, develop, market, cedefop,
Cluster 3 words: education, training, learning, vocational, education, cedefop,
Cluster 4 words: rates, unemployment, area, employability, increasingly, stated,
6.绘图
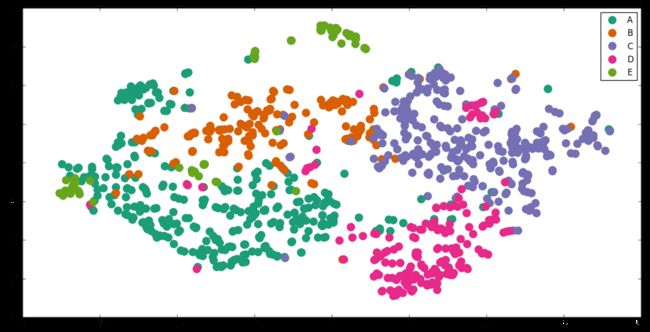
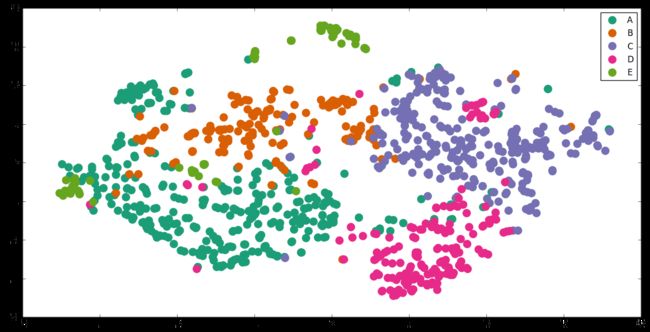
为了实现聚类的可视化,我们应该首先降低其维度。我们用sklearn.manifold库中的t-SNE(t-Distributed Stochastic Neighbor Embedding)来实现。另一种方法是使用PCA或MDS(Multi-Demiensional Scaling)。
绘图是用matplotlib库完成的。
import os  # for os.path.basename

import matplotlib.pyplot as plt
import matplotlib as mpl

from sklearn.manifold import TSNE


tsne = TSNE(n_components=2, verbose=1, perplexity=40, n_iter=300)
# dist is the distance matrix
pos = tsne.fit_transform(dist)

xs, ys = pos[:, 0], pos[:, 1]


cluster_colors = {0: '#1b9e77', 1: '#d95f02', 2: '#7570b3', 3: '#e7298a', 4: '#66a61e'}

cluster_names = {0: 'A',1: 'B',  2: 'C', 3: 'D',  4: 'E'}
[t-SNE] Computing pairwise distances...
[t-SNE] Computing 121 nearest neighbors...
[t-SNE] Computed conditional probabilities for sample 1000 / 1130
[t-SNE] Computed conditional probabilities for sample 1130 / 1130
[t-SNE] Mean sigma: 1.785805
[t-SNE] KL divergence after 100 iterations with early exaggeration: 0.947952
[t-SNE] Error after 125 iterations: 0.947952
%matplotlib inline

df = pd.DataFrame(dict(x=xs, y=ys, label=clusters, title=titles))

groups = df.groupby('label')

fig, ax = plt.subplots(figsize=(16,8) )


for name, group in groups:
    ax.plot(group.x, group.y, marker='o', linestyle='', ms=12,
            label=cluster_names[name], color=cluster_colors[name], mec='none')


ax.legend(numpoints=1)

#we do not present the tiles of items to not make the graph overwhelming
#for i in range(len(df)):
    #ax.text(df.ix[i]['x'], df.ix[i]['y'], df.ix[i]['title'], size=4)


plt.show()
我们可以发现结果并不像我们最初想象的那样糟糕。虽然有一些部分的重叠,但各组是相当有区别的。然而,毫无疑问,我们可以进一步优化它们。
我们应该注意,只有几个字的项目没有在图中显示出来。我还注意到,有一些项目是用不同于英语的语言写的。我们目前没有处理它们,因此,它们的分类实际上是随机的。图中有一些错位的点。
此外,在数据清理和预处理方面还有很多工作要做。一种方法是优化tdidf矢量化的参数,使用doc2vec进行矢量化。或者我们可以使用另一种技术,如亲和传播、频谱聚类或最近的方法,如HDBSCAN和变异自动编码器。

