二分类资料校准曲线calibration curve的绘制
本文首发于公众号:医学和生信笔记
“医学和生信笔记,专注R语言在临床医学中的使用,R语言数据分析和可视化。主要分享R语言做医学统计学、meta分析、网络药理学、临床预测模型、机器学习、生物信息学等。
评价模型的好坏主要看区分度和校准度,校准度方面目前最推荐的还是校准曲线(calibration curve),可用于评价模型预测概率和实际概率一致性。
除了我介绍的这几种方法外,还有predtools、caret等可以用于分类变量的校准曲线绘制。如果你明白了校准曲线就是真实概率和预测概率的分箱平均值散点图,你其实可以自己画,并不局限于logistic和cox,像随机森林、lasso、SVM等很多模型都可以画出校准曲线。
拟合优度检验(Hosmer-Lemeshow goodness-of-fit test)可以用来比较预测概率和实际概率是否有显著性差异,但是这个检验也只是能说明两者有没有统计学意义,并不能说明好多少、差多少。
本期目录:
- 加载数据
- calibration 方法1
- calibration 方法2
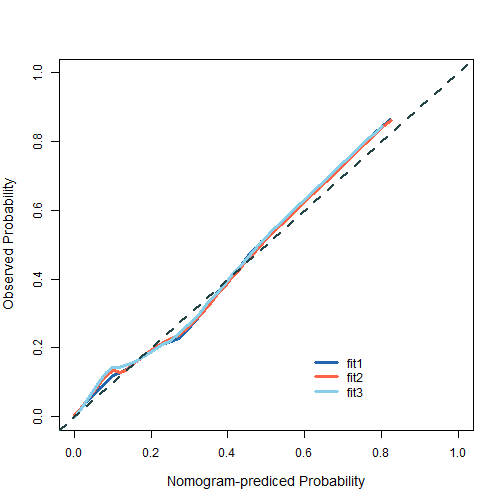
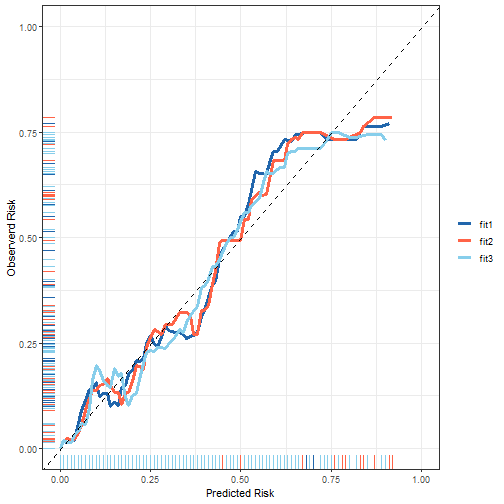
- 多个calibration画在一起
- 方法1
- 方法2
加载数据
使用lowbirth数据集,这个数据集是关于低出生体重儿是否会死亡的数据集,其中dead这一列是结果变量,0代表死亡,1代表存活,其余列都是预测变量。
“注意:需要把分类变量因子化,对于无序分类变量,需要设置哑变量!
lowbirth <- read.csv("../000files/lowbirth.csv")
查看一下数据:
dim(lowbirth) # 565行,10列
## [1] 565  10
str(lowbirth)
## 'data.frame': 565 obs. of  10 variables:
##  $ birth   : num  81.5 81.6 81.6 81.6 81.6 ...
##  $ lowph   : num  7.25 7.06 7.25 6.97 7.32 ...
##  $ pltct   : int  244 114 182 54 282 153 229 182 361 378 ...
##  $ race    : chr  "white" "black" "black" "black" ...
##  $ bwt     : int  1370 620 1480 925 1255 1350 1310 1110 1180 970 ...
##  $ delivery: chr  "abdominal" "vaginal" "vaginal" "abdominal" ...
##  $ apg1    : int  7 1 8 5 9 4 6 6 6 2 ...
##  $ vent    : int  0 1 0 1 0 0 1 0 0 1 ...
##  $ sex     : chr  "female" "female" "male" "female" ...
##  $ dead    : int  0 1 0 1 0 0 0 0 0 1 ...
简单的把人种分为白色和黑色人种(无序分类变量需要设置哑变量),再去掉race这一列,然后其余分类变量因子化。
library(dplyr)
##
## Attaching package: 'dplyr'
## The following objects are masked from 'package:stats':
##
##     filter, lag
## The following objects are masked from 'package:base':
##
##     intersect, setdiff, setequal, union

tmp <- lowbirth %>%
  mutate(across(where(is.character),as.factor),
         vent = factor(vent),
         black = ifelse(race == "black",1,0),
         white = ifelse(race == "white",1,0),
         other = ifelse(race %in% c("native American","oriental"),1,0)
         ) %>%
  select(- race)

glimpse(tmp)
## Rows: 565
## Columns: 12
## $ birth     81.514, 81.552, 81.558, 81.593, 81.610, 81.624, 81.626, 81.68…
## $ lowph     7.250000, 7.059998, 7.250000, 6.969997, 7.320000, 7.160000, 7…
## $ pltct     244, 114, 182, 54, 282, 153, 229, 182, 361, 378, 255, 186, 26…
## $ bwt       1370, 620, 1480, 925, 1255, 1350, 1310, 1110, 1180, 970, 770,…
## $ delivery  abdominal, vaginal, vaginal, abdominal, vaginal, abdominal, v…
## $ apg1      7, 1, 8, 5, 9, 4, 6, 6, 6, 2, 4, 8, 1, 8, 5, 9, 9, 9, 6, 2, 1…
## $ vent      0, 1, 0, 1, 0, 0, 1, 0, 0, 1, 1, 0, 1, 1, 0, 1, 0, 0, 1, 0, 1…
## $ sex       female, female, male, female, female, female, male, male, mal…
## $ dead      0, 1, 0, 1, 0, 0, 0, 0, 0, 1, 0, 0, 0, 0, 0, 0, 0, 0, 1, 0, 0…
## $ black     0, 1, 1, 1, 1, 1, 0, 1, 0, 0, 1, 0, 1, 0, 0, 1, 0, 1, 1, 1, 0…
## $ white     1, 0, 0, 0, 0, 0, 1, 0, 1, 1, 0, 1, 0, 1, 1, 0, 1, 0, 0, 0, 1…
## $ other     0, 0, 0, 0, 0, 0, 0, 0, 0, 0, 0, 0, 0, 0, 0, 0, 0, 0, 0, 0, 0…
calibration 方法1
使用rms包。
library(rms)
## Loading required package: Hmisc
## Loading required package: lattice
## Loading required package: survival
## Loading required package: Formula
## Loading required package: ggplot2
##
## Attaching package: 'Hmisc'
## The following objects are masked from 'package:dplyr':
##
##     src, summarize
## The following objects are masked from 'package:base':
##
##     format.pval, units
## Loading required package: SparseM
##
## Attaching package: 'SparseM'
## The following object is masked from 'package:base':
##
##     backsolve
dd <- datadist(tmp)
options(datadist="dd")

fit2 <- lrm(dead ~ birth + lowph + pltct + bwt + vent + black + white,
            data = tmp,x=T,y=T)

cal2 <- calibrate(fit2, method='boot', B=500)
接下来就是画图:
plot(cal2,
     xlim = c(0,1),
     ylim = c(0,1),
     xlab = "Prediced Probability",
     ylab = "Observed Probability",
     cex.lab=1.2, cex.axis=1, cex.main=1.2, cex.sub=0.8,
     #subtitles = FALSE,
     legend = FALSE
     )
##
## n=565   Mean absolute error=0.013   Mean squared error=3e-04
## 0.9 Quantile of absolute error=0.033
lines(cal2[,c("predy","calibrated.corrected")],
      type = 'l', #连线的类型,可以是"p","b","o"
      lwd = 3, #连线的粗细
      pch = 16, #点的形状,可以是0-20
      col = "#2166AC") #连线的颜色
lines(cal2[,c("predy","calibrated.orig")],type="l",pch=16,lwd=3,col="tomato")
abline(0,1,
       lty = 2, #对角线为虚线
       lwd = 2, #对角线的粗细
       col = "#224444") #对角线的颜色
legend(0.6,0.2,
       c("Apparent","Bias-corrected","Ideal"),
       lty = c(2,1,1),
       lwd = c(2,3,3),
       col = c("black","#2166AC","tomato"),
       bty = "n"
)
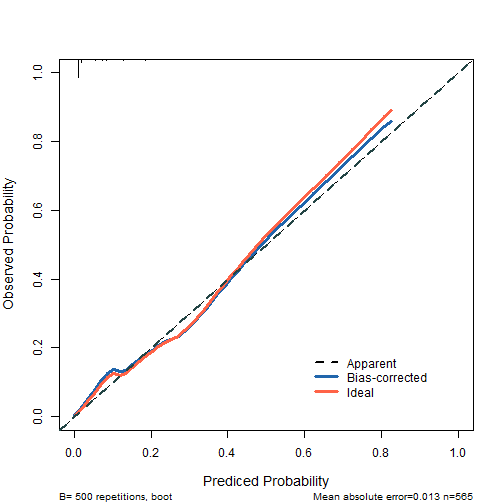 plot of chunk unnamed-chunk-5
还可以计算hosmer-lemeshow的P值。
# 进行hosmer-lemeshow 检验
library(ResourceSelection)
## ResourceSelection 0.3-5   2019-07-22

model_glm <- glm(dead ~ birth + lowph + pltct + bwt + vent + black + white,
            data = tmp, family = binomial)

# hosmer-lemeshow 检验
p.hoslem <- hoslem.test(model_glm$y, fitted(model_glm), g=10)$p.value
p.hoslem
## [1] 0.2340365

# 构建 calibration
fit2 <- lrm(dead ~ birth + lowph + pltct + bwt + vent + black + white,
            data = tmp,x=T,y=T)

cal2 <- calibrate(fit2, method='boot', B=500)
画图还是和上面一样,就是多了一个添加 hosmer-lemeshow P值的步骤。
plot(cal2,
     xlim = c(0,1),
     ylim = c(0,1),
     xlab = "Prediced Probability",
     ylab = "Observed Probability",
     cex.lab=1.2, cex.axis=1, cex.main=1.2, cex.sub=0.8,
     #subtitles = FALSE,
     legend = FALSE
     )
##
## n=565   Mean absolute error=0.013   Mean squared error=3e-04
## 0.9 Quantile of absolute error=0.033
lines(cal2[,c("predy","calibrated.corrected")],
      type = 'l', #连线的类型,可以是"p","b","o"
      lwd = 3, #连线的粗细
      pch = 16, #点的形状,可以是0-20
      col = "#2166AC") #连线的颜色
lines(cal2[,c("predy","calibrated.orig")],type="l",pch=16,lwd=3,col="tomato")
abline(0,1,
       lty = 2, #对角线为虚线
       lwd = 2, #对角线的粗细
       col = "#224444")#对角线的颜色
legend(0.6,0.2,
       c("Apparent","Bias-corrected","Ideal"),
       lty = c(2,1,1),
       lwd = c(2,3,3),
       col = c("black","#2166AC","tomato"),
       bty = "n"
)
text(0,0,bquote("Hosmer-Lemeshow "~italic(P)~" = "~.(round(p.hoslem,3))),adj = 0)
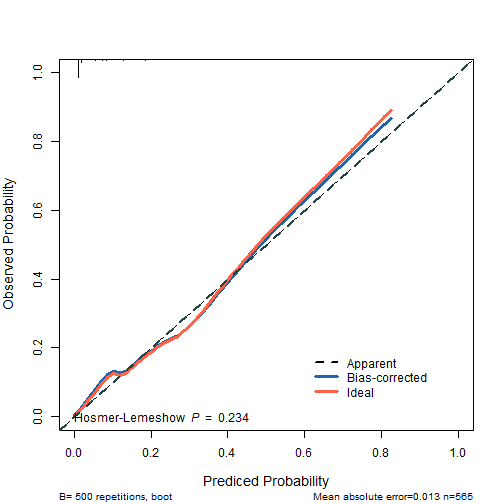 plot of chunk unnamed-chunk-7
calibration 方法2
使用riskRegression包。
fit2 <- glm(dead ~ birth + lowph + pltct + bwt + vent + black + white,
            data = tmp, family = binomial)
library(riskRegression)
## riskRegression version 2022.03.22

fit22 <- Score(list("fit"=fit2),
               formula = dead ~ 1,
               data = tmp,
               metrics = c("auc","brier"),
               summary = c("risks","IPA","riskQuantile","ibs"),
               plots = "calibration",
               null.model = T,
               conf.int = T,
               B = 500,
               M = 50
               )
plotCalibration(fit22,col="tomato",
                xlab = "Predicted Risk",
                ylab = "Observerd RISK",
                bars = F)
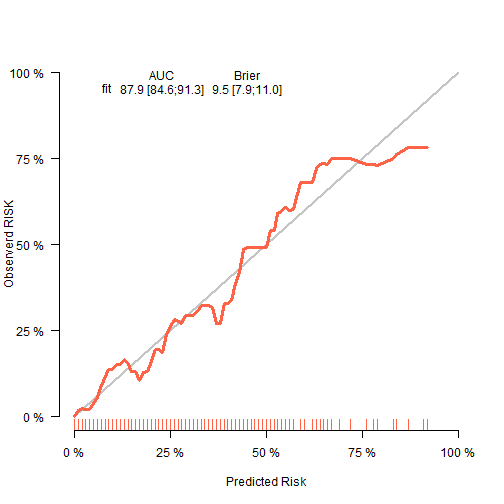 plot of chunk unnamed-chunk-9
非常神奇的是,还可以用ggplot2来画!
plotdata <- plotCalibration(fit22,plot = F,method = "nne"
                            #bandwidth = 0.1
                            )

library(ggplot2)

ggplot(plotdata$plotFrames$fit, aes(x=Pred,y=Obs))+
  geom_line(color="tomato",size=1.5)+
  scale_x_continuous(limits = c(0,1),name = "Predicted Risk")+
  scale_y_continuous(limits = c(0,1),name = "Observerd Risk")+
  geom_abline(slope = 1,intercept = 0,lty=2)+
  geom_rug(color="grey")+
  theme_bw()
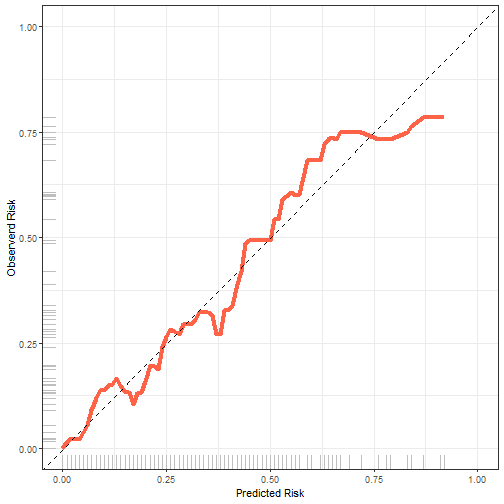 plot of chunk unnamed-chunk-10
多个calibration画在一起
方法1
首先构建多个画图需要的结果:
fit2 <- lrm(dead ~ birth + lowph + pltct + bwt + vent + black + white,
            data = tmp,x=T,y=T)
cal2 <- calibrate(fit2, method='boot', B=500)

fit1 <- lrm(dead ~ lowph + bwt + vent + black,
            data = tmp,x=T,y=T)
cal1 <- calibrate(fit1, method='boot', B=500)

fit3 <- lrm(dead ~ birth + lowph + pltct + bwt + vent,
            data = tmp,x=T,y=T)
cal3 <- calibrate(fit3, method='boot', B=500)
然后使用基础函数画在一起即可:
plot(1,
     type = "n",
     xlim = c(0,1),
     ylim = c(0,1),
     xlab = "Nomogram-prediced Probability",
     ylab = "Observed Probability",
     cex.lab=1.2, cex.axis=1, cex.main=1.2, cex.sub=0.8
)
lines(cal1[,c("predy","calibrated.corrected")],
      type = 'l', #连线的类型,可以是"p","b","o"
      lwd = 3, #连线的粗细
      pch = 16, #点的形状,可以是0-20
      col = "#2166AC") #连线的颜色
lines(cal2[,c("predy","calibrated.corrected")],type="l",pch=16,lwd=3,col="tomato")
lines(cal3[,c("predy","calibrated.corrected")],type="l",pch=16,lwd=3,col="skyblue")
abline(0,1,
       lty = 2, #对角线为虚线
       lwd = 2, #对角线的粗细
       col = "#224444")#对角线的颜色
legend(0.6,0.2,
       c("fit1","fit2","fit3"),
       lty = c(1,1,1),
       lwd = c(3,3,3),
       col = c("#2166AC","tomato","skyblue"),
       bty = "n"
)
 plot of chunk unnamed-chunk-12
方法2
library(riskRegression)

fit1 <- glm(dead ~ lowph + bwt + vent + black,data = tmp,family=binomial)
fit2 <- glm(dead ~ birth + lowph + pltct + bwt + vent + black + white,
            data = tmp, family = binomial)
fit3 <- glm(dead ~ birth + lowph + pltct + bwt + vent,data=tmp,
            family=binomial)

fit_all <- Score(list("Fit1"=fit1,
                      "Fit2"=fit2,
                      "Fit3"=fit3
                      ),
               formula = dead ~ 1,
               data = tmp,
               metrics = c("auc","brier"),
               summary = c("risks","IPA","riskQuantile","ibs"),
               plots = "calibration",
               null.model = T,
               conf.int = T,
               B = 500,
               M = 50
               )

data_all <- plotCalibration(fit_all,plot = F)
接下来数据稍作变换,就可以画图了!
plot_df <- bind_rows(data_all$plotFrames) %>%
  mutate(fits = rep(c("fit1","fit2","fit3"),each=76))

ggplot(plot_df, aes(Pred,Obs))+
  geom_line(aes(group=fits,color=fits),size=1.2)+
  scale_color_manual(values = c("#2166AC","tomato","skyblue"),name=NULL)+
  scale_x_continuous(limits = c(0,1),name = "Predicted Risk")+
  scale_y_continuous(limits = c(0,1),name = "Observerd Risk")+
  geom_abline(slope = 1,intercept = 0,lty=2)+
  geom_rug(aes(color=fits))+
  theme_bw()
 plot of chunk unnamed-chunk-14
获取lowbirth数据请在公众号后台回复20220520。
本文首发于公众号:医学和生信笔记
“医学和生信笔记,专注R语言在临床医学中的使用,R语言数据分析和可视化。主要分享R语言做医学统计学、meta分析、网络药理学、临床预测模型、机器学习、生物信息学等。
本文由 mdnice 多平台发布