Matplotlib之标注图像的annotate和text函数
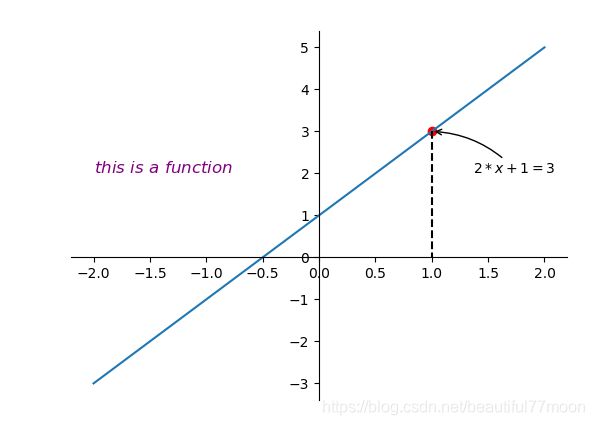
怎样在图上标出下图所示的信息:
请看代码:
import matplotlib.pyplot as plt
from numpy import *
x=linspace(-2,2)
y=2*x+1
ax=plt.gca()
ax.spines['right'].set_color('none')
ax.spines['top'].set_color('none')
ax.spines['bottom'].set_position(('data',0))
ax.spines['left'].set_position(('data',0))
plt.plot(x,y)

x0=1
y0=2*x0+1
plt.scatter(x0,y0,color='red')#在图上画出这个点
#通过这个点做垂直于x轴的直线
plt.plot([x0,x0],[y0,0],linestyle='--',color='black')#在(x0,y0)和(x0,0)两点之间画一条直线

#Method1:annotate标注图像
plt.annotate(r'$2*x+1=3$',xy=(x0,y0),xycoords='data',xytext=(+30,-30),textcoords='offset points',
             arrowprops=dict(arrowstyle='->',connectionstyle='arc3,rad=.2'))

#Method2:text标注图像
plt.text(-2,2,r'$this\ is\ a\ function$',fontdict={'size':12,'color':'purple'})#设置文字开始显示的位置、显示内容和字体


plt.show()     #显示
代码解释:
- plot()函数表示画连续的函数线,scatter()函数画的是散点。
- plt.annotate()中的参数解释:xy=(x0,y0):设置一个参照点;xycoords='data':参照点的单位是一个值的形式;xytext=(+30,-30):标注文本的偏移量,相对于参照点的偏移量;textcoords=‘offset points’:注释文本的坐标系属性,表示以点为单位,也可以是pixels,表示以像素为单位,还可以是xycoords的属性值。arrowprops表示设置箭头的属性,有箭头的样式和箭头的弧度。annotate函数的详解请看:https://blog.csdn.net/u013457382/article/details/50956459
- plt.text()函数中的前两个参数表示文字开始显示的位置。
