实验四 matplotlib的基本使用
实验四 matplotlib的基本使用
实验所需要的文件
链接:https://pan.baidu.com/s/1BAhO_vaz71bhzZzqKoI2nA
提取码:7pqk
1.实验内容
(1)matplotlib的导入。
(2)matplotlib图形基本设置。
(3)matplotlib折线图的绘制。
(4)matplotlib饼图的绘制。
(5)matplotlib散点图的绘制。
(6)matplotlib条形图的绘制。
(7)matplotlib盒形图的绘制。
(8)词云图的绘制。
2.目的要求
(1)学会matplotlib的导入。
(2)掌握matplotlib图形的基本设置。
(3)掌握matplotlib折线图的绘制。
(4)掌握matplotlib饼图的绘制。
(5)掌握matplotlib散点图的绘制。
(6)掌握matplotlib条形图的绘制。
(7)掌握matplotlib盒形图的绘制。
(8)掌握词云图的绘制。
3.实验方法手段及其条件
(1)导入matplotlib、numpy和pandas并解决中文乱码问题。
%matplotlib inline
import matplotlib as mpl
import matplotlib.pyplot as plt
import numpy as np
import pandas as pd
#设置rc参数显示中文标题,设置字体为SimHei国标黑体显示中文
plt.rcParams[‘font.sans-serif’] = ‘SimHei’
plt.rcParams[‘axes.unicode_minus’] = False #设置正常显示字符
(2)在同一坐标系中绘制多种曲线,通过样式、宽度、颜色加以区分并设置标题、坐标轴名称。
x = np.linspace(0, 3, 200) #产生从0到3均匀分布的200个浮点ndarray
三条线段颜色取值为蓝、绿、青,编写程序输出如下图形:
%matplotlib inline
import matplotlib as mpl
import matplotlib.pyplot as plt
import numpy as np
import pandas as pd
#设置rc参数显示中文标题,设置字体为SimHei国标黑体显示中文
plt.rcParams['font.sans-serif'] = 'SimHei'
plt.rcParams['axes.unicode_minus'] = False   #设置正常显示字符
x = np.linspace(0, 3, 200)
y=x
y1=x**2
y2=x**3
l1,=plt.plot(x,y)
l2,=plt.plot(x,y1,'b--')
l3,=plt.plot(x,y2,'g:')
plt.xlabel('x轴')
plt.ylabel('y轴')
plt.title("My First Plot")
plt.annotate(s='Here I am',xy=(1,1),xytext=(3.5,-0.5),\
             weight='bold',color='black',\
             arrowprops=dict(arrowstyle='-|>',connectionstyle='arc3',color='red'),\
             bbox=dict(boxstyle='round,pad=0.5', fc='yellow', ec='black',lw=1 ,alpha=0.4))

plt.legend(handles=[l1, l2,l3],labels=['y = x$^{1}$','y = x$^{2}$','y = x$^{3}$'],frameon=False)
plt.show()
(3)将多幅子图绘制在同一画板。
#读入当前文件夹下的学生成绩文件“scoresheet.xlsx”stuscore=pd.read_excel(‘scoresheet.xlsx’,header=None,
names=[‘id’,‘name’,‘gender’,‘english’,‘math’,
‘ethnic theory’,‘physics’])
stuscore #显示文件内容
plt.figure(figsize=(12,10)) #设置画布大小
#用hsapce和wspace调整图与图之间的行列间隙
plt.subplots_adjust(hspace=0.45,wspace=0.2)
要求:编写程序将4幅子图绘制在同一画板,所有图形使用默认颜色,输出结果如下图所示:

stuscore=pd.read_excel('scoresheet.xlsx',header=None,
                       names=['id','name','gender','english','math',
                        'ethnic theory','physics'])
stuscore  #显示文件内容
plt.subplot(221)
plt.plot(stuscore['english'],label='english score')
plt.plot(stuscore['math'],label='math score')
plt.plot(stuscore['ethnic theory'],label='ethnic theory score')
plt.plot(stuscore['physics'],label='phtsics score')
plt.legend(loc=8,frameon=False,bbox_to_anchor=(0.5,-0.8))
plt.title("学生期末各科成绩折线图")

plt.subplot(222);
plt.bar(stuscore['name'], stuscore['physics'])
plt.xticks(rotation=40)#调节x轴标签倾斜度
plt.title('学生期末成绩物理条形图')

plt.subplot(223);
plt.scatter(stuscore['ethnic theory'],stuscore['physics'])
plt.title("学生民族理论和物理成绩散点图")

plt.subplot(224);
n = [stuscore['gender'].value_counts()[0],stuscore['gender'].value_counts()[1]]
plt.pie(n, labels=['男', '女'],autopct='%1.1f%%')
plt.title("学生性别比例饼图")

plt.figure(figsize=(12,10))  #设置画布大小
#用hsapce和wspace调整图与图之间的行列间隙
plt.subplots_adjust(hspace=0.45,wspace=0.2)
plt.tight_layout()
plt.show()
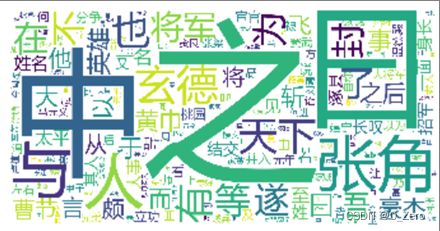
(4)读入当前文件夹下的“sanguo.csv”,完成对《三国演义》小说的文档读取以及词云图片输出。输出结果如下图所示。
写之前先安装jieba库和wordcloud库
jieba库:pip install jieba
wordcloud库:pip install wordcloud
import numpy as np
import pandas as pd
import matplotlib.pyplot as plt
import jieba
from wordcloud import WordCloud
%matplotlib inline
s=pd.read_csv('sanguo.csv',encoding='utf-8')
mylist=s['三国演义']#指定用于制图的文本,也可以使用列表或元组等序列。
word_list=[" ".join(jieba.cut(sentence)) for sentence in mylist]
new_text=' '.join(word_list) #将所有文本字符链接起来
wordcloud=WordCloud(font_path='./msyh/msyh.ttc',
                    background_color="white",
                    width=2000,height=1000,
                    max_words=200).generate(new_text)
#wordcloud对象用于设置词云图的字体、背景颜色、最大词频数等。
plt.imshow(wordcloud)
plt.axis("off") #关闭显示坐标轴
plt.show()

