python高斯噪声怎么去除_图像质量评估:BRISQUE | 附 C++和Python代码
作者:小白学视觉,已授权转载,如需转载请联系原作者
原文链接: https:// mp.weixin.qq.com/s? __biz=MzU0NjgzMDIxMQ==&mid=2247488183&idx=2&sn=7f752ef74e7476faf6404a06720099de&chksm=fb56f05bcc21794dd306799242dd63fe89c0a9f157b694aa9c8c6d2717e27665448a772fcdf6&scene=27#wechat_redirect
我们都知道拍摄相片容易,但是想拍摄高质量的图片却很难,它需要良好的构图和照明。此外,选择正确的镜头和优质的设备也会提高图像的质量。但是,最重要的是,拍摄高质量的图片需要良好的品味和判断力,也就是我们需要专家级的眼光。
但是,能否有一种对图像质量人为判定标准的数学度量呢?
答案既是肯定的,也是否定的!
有一些质量度量很容易被算法捕获。例如,我们可以通过对图像的像素的判断来判定某张图像是否嘈杂或者模糊
另一方面,也有一些图像质量评判标准无法通过算法来计算。例如,算法很难评估图像背景的文化信息,进而难以评判图片质量。
在本文中,我们将学习预测图像质量得分的算法
注意:本教程已在Ubuntu 18.04、16.04,Python 3.6.5,Python 2.7和OpenCV 3.4.1和4.0.0-pre版本上进行了测试。
什么是图像质量评估(IGA)?
图像质量评估算法是对任意的图像进行质量评分,将图像整体作为输入,将图像的质量得分作为输出,图像质量评估分为三种:
- 全参考图像质量评估:在这种方法中,我们拥有一个非失真的图像,以测量失真图像的质量。在我们可以拥有原始图像及其压缩图像的情况下,此方法可用于评估图像压缩算法的质量。
- 降低参考的图像质量评估:在这种方法中没有可以用来参考的图像,但是具有参考信息的图像(例如,带有水印的图像)可以比较和测量失真图像的质量。
- 无参考图像质量评估:算法获得的唯一输入是要测量其质量的图像,完全没有可以用来参考的图像,因此被称为无参考“No-Reference”
无参考IQA
本文中我们将讨论一种称为无参考图像空间质量评估器(BRISQUE)的无参考IQA度量标准。在深入研究该理论之前,让我们首先了解两个基本术语:
1.失真图像(Distorted Image):顾名思义,失真图像是原始图像的一个演变,该图像因模糊,噪点,水印,颜色变换,几何变换等而使数据失去了原始的磨样。
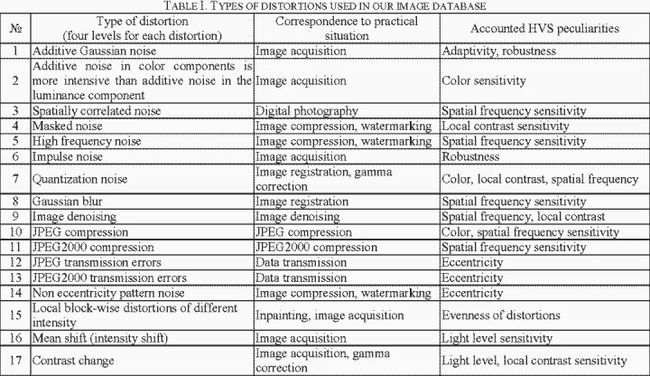
图1 TID 2008数据库中使用的失真2.自然图像(Natural Image):在本文中,我们是指未经后期处理直接由相机捕获的图像。下面是自然图像和失真图像的示例。
图2 自然图像(左)和噪声图像(失真,右)图像质量评估(IQA)数据集
质量是一个主观问题。要悬链一种有关质量好坏的算法,我们需要许多图像示例及其质量得分。
谁为这些训练图像指定质量得分?人类,当然。但是我们不能仅仅依靠一个人的意见。因此,我们需要几个人的意见,并将图像的平均得分分配为0(最佳)到100(最差)之间。该分数在学术文献中被称为平均质量分数。
我们可以直接使用名为“TID2008”的数据集来训练和测试我们的算法。
无参考图像空间质量评估器(BRISQUE)
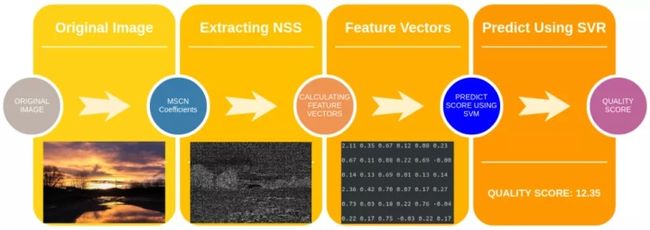
在本节中,我们将介绍用于无参考IQA的BRISQUE算法所需的步骤。整体流程入图3所示。
图3 使用BRISQUE模型计算图像质量得分的步骤步骤1:提取自然场景统计信息(NSS)
自然图像的像素强度分布与失真图像的像素强度分布不同。当我们对像素强度进行归一化并在这些归一化强度上计算分布时,分布上的差异更加明显。特别地,在归一化之后,自然图像的像素强度遵循高斯分布(贝尔曲线),而非自然或失真图像的像素强度则不遵循高斯分布(贝尔曲线)。因此,分布曲线与理想高斯曲线的偏差是图像失真量的度量。具体形式入下图所示。
图4左侧:显示没有添加人工效果的自然图像,符合高斯分布。右图:人造图像,不太适合同一分布均值减去对比度归一化(MSCN)
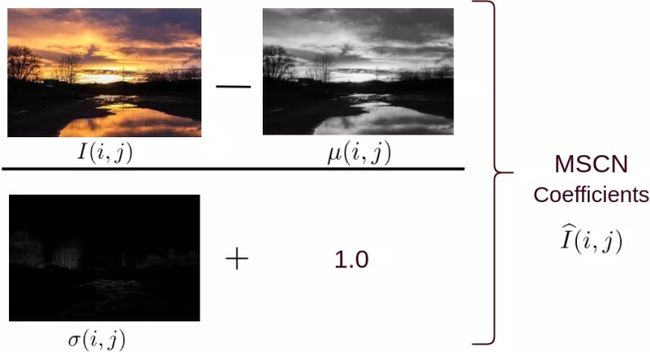
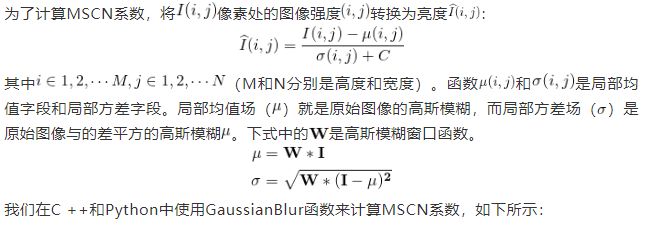
有几种不同的标准化图像的方法。我们使用均值减去对比度归一化(MSCN)。下图显示了如何计算MSCN系数。
图5 计算MSCN系数的步骤可以形象化为:
图6 MSCN系数的计算接下来我们介绍起数学原理:
C++
Mat im = imread("image_scenery.jpg"); // read image

cvtColor(im, im, COLOR_BGR2GRAY); // convert to grayscale


im.convertTo(im, 1.0/255); // normalize and copy the read image to orig_bw
Mat mu(im.size(), CV_64FC1, 1);
GaussianBlur(im, mu, Size(7, 7), 1.166); // apply gaussian blur
Mat mu_sq = mu.mul(mu);


// compute sigma
Mat sigma = im.size(), CV_64FC1, 1);
sigma = im.mul(im);
GaussianBlur(sigma, sigma, Size(7, 7), 1.166); // apply gaussian blur
subtract(sigma, mu_sq, sigma); // sigma = sigma - mu_sq
cv::pow(sigma, double(0.5), sigma); // sigma = sqrt(sigma)
add(sigma, Scalar(1.0/255), sigma); // to avoid DivideByZero Exception
Mat structdis(im.size(), CV_64FC1, 1);
subtract(im, mu, structdis); // structdis = im - mu
divide(structdis, sigma, structdis);
Python
im = cv2.imread("image_scenery.jpg", 0) # read as gray scale
blurred = cv2.GaussianBlur(im, (7, 7), 1.166) # apply gaussian blur to the image
blurred_sq = blurred * blurred
sigma = cv2.GaussianBlur(im * im, (7, 7), 1.166)
sigma = (sigma - blurred_sq) ** 0.5
sigma = sigma + 1.0/255 # to make sure the denominator doesn't give DivideByZero Exception
structdis = (im - blurred)/sigma # final MSCN(i, j) image
MSCN为像素强度提供了良好的标准化。但是,自然图像与失真图像之间的差异不仅限于像素强度分布,还包括像素与其相邻像素之间的关系。
为了捕获邻域关系,作者使用了MSCN图像的成对乘积和MSCN图像的偏移版本。四个方向用于查找MSCN系数的成对乘积,即:水平(H),垂直(V),左对角线(D1),右对角线(D2)。
可以使用Python和C ++计算成对乘积,如下所示:
C++
// declare shifting indices array
int shifts[4][2] = {{0, 1}, {1, 0}, {1, 1}, {-1, 1}};


// calculate pair-wise products for every combination of shifting indices
for(int itr_shift = 1; itr_shift <= 4; itr_shift++)
{
    int* reqshift = shifts[itr_shift - 1]; // the required shift index
    // declare shifted image
    Mat shifted_structdis(imdist_scaled.size(), CV_64F, 1);
    // BwImage is a helper class to create a copy of the image and create helper functions to access it's pixel values
    BwImage OrigArr(structdis);
    BwImage ShiftArr(shifted_structdis);
    // calculate pair-wise component for the given orientation
    for(int i = 0; i < structdis.rows; i++)
    {
        for(int j = 0; j < structdis.cols; j++) { if(i + reqshift[0] >= 0 && i + reqshift[0] < structdis.rows && j + reqshift[1] >= 0 && j + reqshift[1] < structdis.cols)
            {
                ShiftArr[i][j] = OrigArr[i + reqshift[0]][j + reqshift[1]];
            }f
            else
            {
                ShiftArr[i][j] = 0;
            }
        }
    }
    Mat shifted_new_structdis;
    shifted_new_structdis = ShiftArr.equate(shifted_new_structdis);
    // find the pairwise product
    multiply(structdis, shifted_new_structdis, shifted_new_structdis);
}
Python
# indices to calculate pair-wise products (H, V, D1, D2)
shifts = [[0,1], [1,0], [1,1], [-1,1]]
# calculate pairwise components in each orientation
for itr_shift in range(1, len(shifts) + 1):
    OrigArr = structdis
    reqshift = shifts[itr_shift-1] # shifting index


    for i in range(structdis.shape[0]):
        for j in range(structdis.shape[1]):
            if(i + reqshift[0] >= 0 and i + reqshift[0] < structdis.shape[0]  and j + reqshift[1] >= 0 and j  + reqshift[1] < structdis.shape[1]):
               ShiftArr[i, j] = OrigArr[i + reqshift[0], j + reqshift[1]]
            else:
               ShiftArr[i, j] = 0
可以使用cv2.warpAffine函数如下所示的功能将两个for循环简化为几行。这将极大的加速程序的书写。
# create affine matrix (to shift the image)
M = np.float32([[1, 0, reqshift[1]], [0, 1, reqshift[0]]])
ShiftArr = cv2.warpAffine(OrigArr, M, (structdis.shape[1], structdis.shape[0])
步骤2:计算特征向量
到目前为止,我们已经从原始图像中生成了5张图像:1张MSCN图像和4张成对乘积图像,以捕获邻居关系(水平,垂直,左对角线,右对角线)。
接下来,我们将使用这5张图像来计算大小为36×1(即18个数字的数组)的特征向量。请注意,原始输入图像可以是任何尺寸(宽度/高度),但是特征向量的大小始终为36×1。
通过将MSCN图像拟合到广义高斯分布(GGD),可以计算出36×1特征向量的前两个元素。GGD有两个参数:一个用于形状(shape),一个用于方差。
接下来,将非对称广义高斯分布(AGGD)拟合到四个成对乘积图像中的每一个。AGGD是广义高斯拟合(GGD)的不对称形式。它具有四个参数:形状,平均值,左方差和右方差。由于有4个成对的产品图片,因此最终得到16个值。
因此,我们最终得到特征向量的18个元素。将图像缩小到原始大小的一半,并重复相同的过程以获得18个新数字,使总数达到36个数字。
步骤3:预测影像品质分数
在典型的机器学习应用程序中,图像首先被转换为特征向量。然后,将训练数据集中所有图像的特征向量和输出(在这种情况下为质量得分)馈送到诸如支持向量机(SVM)之类的学习算法。
在本文中,我们将仅使用作者提供的训练后的模型。
我们使用LIBSVM,首先加载经过训练的模型,然后使用由模型产生的支持向量来预测概率来预测最终质量得分。重要的是要注意,特征向量首先需要缩放到-1到1,然后再用于预测。
具体代码如下:
C++
// make a svm_node object and push values of feature vectors into it
struct svm_node x[37];


// features is a rescaled vector to (-1, 1)
for(int i =; i < 36; ++i) {
  x[i].value = features[i];
  x[i].index = i + 1; // svm_node indexes start from 1
}


// load the model from modelfile - allmodel
string model = "allmodel";
model = svm_load_model(modelfile.c_str())


// get number of classes from the model
int nr_class = svm_get_nr_class(model);
double *prob_estimates = (double *) malloc(nr_class*sizeof(double));


// predict the quality score using svm_predict_probability function
qualityscore = svm_predict_probability(model, x, prob_estimates);
Python
# load the model from allmodel file
model = svmutil.svm_load_model("allmodel")
# create svm node array from features list
x, idx = gen_svm_nodearray(x[1:], isKernel=(model.param.kernel_type == PRECOMPUTED))
nr_classifier = 1 # fixed for svm type as EPSILON_SVR (regression)
prob_estimates = (c_double * nr_classifier)()


# predict quality score of an image using libsvm module
qualityscore = svmutil.libsvm.svm_predict_probability(model, x, dec_values)
接下来我们开始执行BRISQUE Metric,我们在原代码的基础上对代码进行了一些小的更改,使其可以与OpenCV 3.xy和Python 3.x版本一起使用。
C++:
1.下载源码:将存储库克隆或存储到当前目录
2.执行:我们已经编译了代码,工作文件在存储库中。使用以下命令检查您的代码:./brisquequality "image_path"
Python:
# Python 2.7
python2 brisquequality.py
# Python 3.x
python3 brisquequailty.py
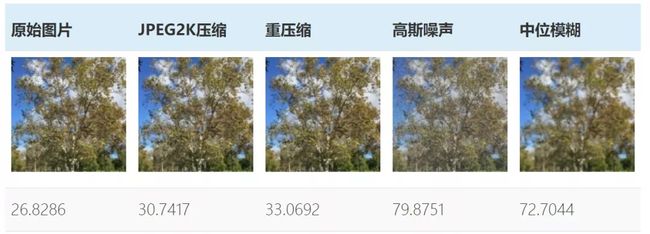
我们已经对4种类型的失真执行了度量。这是每种失真的最终质量得分(得分越高,质量越差):
本文涉及到的代码,
https://github.com/spmallick/learnopencv/tree/master/ImageMetricswx.qq.com参考文献:
- No-Reference Image Quality Assessment in the Spatial Domain
- Laboratory for Image and Video Engineering
- Trained model file for BRISQUE Image Quality Assessment
- TID 2008 – A Database for Evaluation of Full-Reference Visual Quality Assessment Metrics
关注 搜罗最好玩的计算机视觉论文和应用,AI算法与图像处理 微信公众号,获得第一手计算机视觉相关信息
