图像处理第七章图像分割
7.1
f = imread('路径');
w = [-1 -1 -1;-1 8 -1;-1 -1 -1];                    % 点检测掩模
g = abs(imfilter(double(f),w));
T = max(g(:));
g = g>=T;
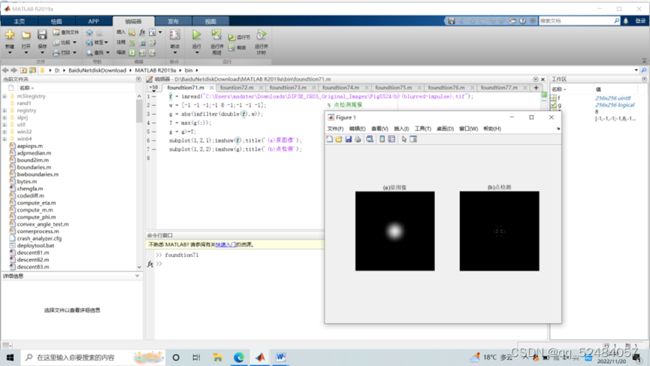
subplot(1,2,1);imshow(f);title('(a)原图像');
subplot(1,2,2);imshow(g);title('(b)点检测');
7.2
f = imread('路径');     % 图像大小:486×486
w = [2 -1 -1;-1 2 -1;-1 -1 2];          % +45°方向检测线
g = imfilter(double(f),w);
gtop = g(1:120,1:120);                  % 左上角区域
gtop = pixeldup(gtop,4);                % 通过复制像素将图像扩大gtop*4倍
gbot = g(end-119:end,end-119:end);      % 右下角区域
gbot = pixeldup(gbot,4);
g1 = abs(g);                             % 检测图的绝对值
T = max(g1(:));
g2 = g1>=T;

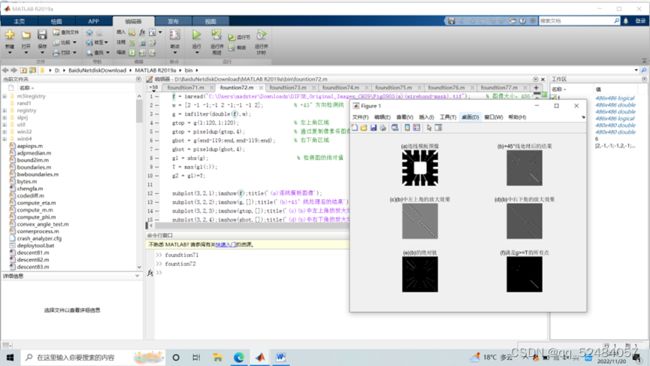
subplot(3,2,1);imshow(f);title('(a)连线模板图像');
subplot(3,2,2);imshow(g,[]);title('(b)+45°线处理后的结果');
subplot(3,2,3);imshow(gtop,[]);title('(c)(b)中左上角的放大效果');
subplot(3,2,4);imshow(gbot,[]);title('(d)(b)中右下角的放大效果');
subplot(3,2,5);imshow(g1,[]);title('(e)(b)的绝对值');
subplot(3,2,6);imshow(g2);title('(f)满足g>=T的所有点');
7.3
f = imread('路径');     % 图像大小:486×486
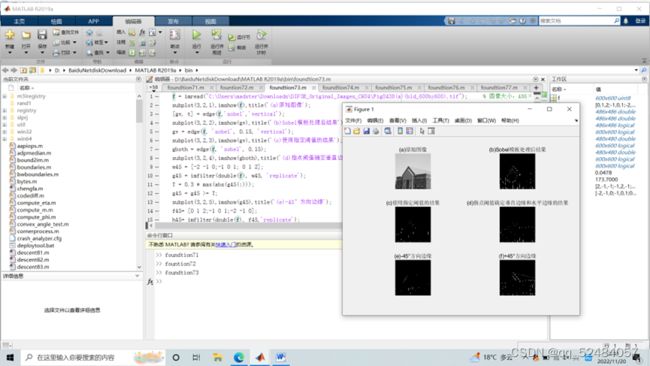
subplot(3,2,1),imshow(f),title('(a)原始图像');
[gv, t] = edge(f,'sobel','vertical');
subplot(3,2,2),imshow(gv),title('(b)Sobel模板处理后结果');
gv = edge(f, 'sobel', 0.15, 'vertical');
subplot(3,2,3),imshow(gv),title('(c)使用指定阈值的结果');
gboth = edge(f, 'sobel', 0.15);
subplot(3,2,4),imshow(gboth),title('(d)指点阈值确定垂直边缘和水平边缘的结果');
w45 = [-2 -1 0;-1 0 1; 0 1 2];
g45 = imfilter(double(f), w45, 'replicate');
T = 0.3 * max(abs(g45(:)));
g45 = g45 >= T;
subplot(3,2,5),imshow(g45),title('(e)-45°方向边缘');
f45= [0 1 2;-1 0 1;-2 -1 0];
h45= imfilter(double(f), f45,'replicate');
T = 0.3 * max(abs(h45(:)));
h45 = h45 >= T;
subplot(3,2,6),imshow(h45),title('(f)+45°方向边缘');
7.4
f = imread('路径');     % 图像大小:486×486
[g_sobel_default,ts] = edge(f,'sobel');
[g_log_default,tlog] = edge(f,'log');
[g_canny_default,tc] = edge(f,'canny');

g_sobel_best = edge(f,'sobel',0.05);
g_log_best = edge(f,'log',0.003,2.25);
g_canny_best = edge(f,'canny',[0.04 0.10],1.5);

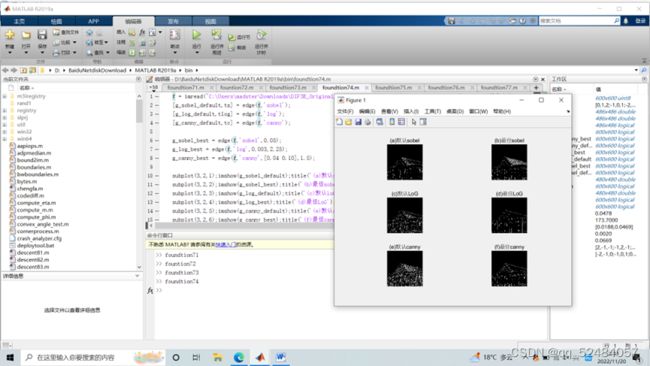
subplot(3,2,1);imshow(g_sobel_default);title('(a)默认sobel');
subplot(3,2,2);imshow(g_sobel_best);title('(b)最佳sobel');
subplot(3,2,3);imshow(g_log_default);title('(c)默认LoG');
subplot(3,2,4);imshow(g_log_best);title('(d)最佳LoG');
subplot(3,2,5);imshow(g_canny_default);title('(e)默认canny');
subplot(3,2,6);imshow(g_canny_best);title('(f)最佳canny');
7.5
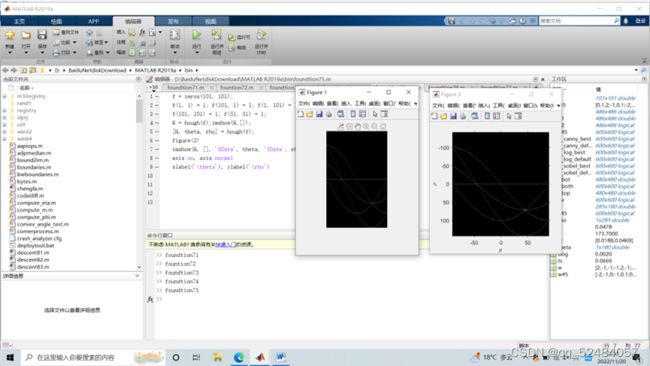
f = zeros(101, 101);
f(1, 1) = 1; f(101, 1) = 1; f(1, 101) = 1;
f(101, 101) = 1; f(51, 51) = 1;
H = hough(f);imshow(H,[]);
[H, theta, rho] = hough(f);
figure(2)
imshow(H, [], 'XData', theta, 'YData', rho ,'InitialMagnification', 'fit')
axis on, axis normal
xlabel('\theta'), ylabel('\rho')
7.6
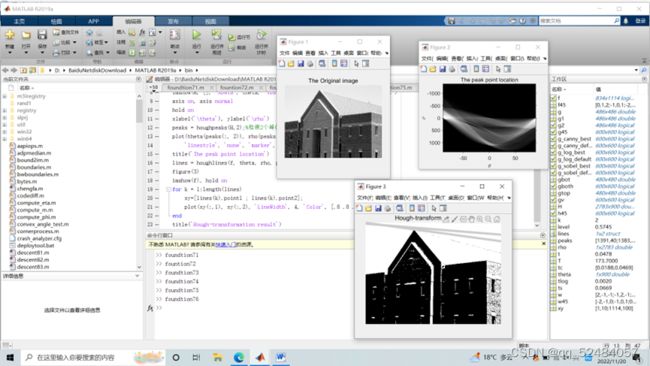
f=imread('路径');
figure(1)
imshow (f);title('The Original image')
level=graythresh(f);
f=im2bw(f);
[H, theta, rho] = hough(f, 'ThetaResolution', 0.2);
figure(2)
imshow(H, [], 'XData', theta, 'YData', rho, 'InitialMagnification', 'fit')
axis on, axis normal
hold on
xlabel('\theta'), ylabel('\rho')
peaks = houghpeaks(H,2);%检测2个峰值点
plot(theta(peaks(:, 2)), rho(peaks(:, 1)), ...
    'linestyle', 'none', 'marker', 's', 'color', 'w')
title('The peak point location')
lines = houghlines(f, theta, rho, peaks);
figure(3)
imshow(f), hold on
for k = 1:length(lines)
    xy=[lines(k).point1 ; lines(k).point2];
    plot(xy(:,1), xy(:,2), 'LineWidth', 4, 'Color', [.8 .8 .8]);
end
title('Hough-transformation result')
7.7
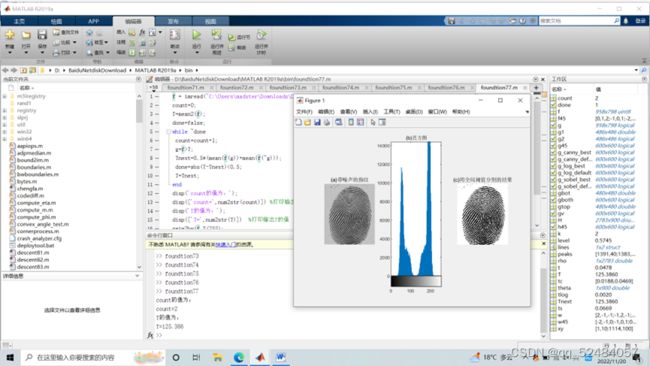
f = imread('路径');
count=0;
T=mean2(f);
done=false;
while ~done
 count=count+1;
 g=f>T;
 Tnext=0.5*(mean(f(g))+mean(f(~g)));
 done=abs(T-Tnext)<0.5;
 T=Tnext;
end
disp('count的值为:');
disp(['count=',num2str(count)]) %打印输出count的值
disp('T的值为:');
disp(['T=',num2str(T)])  %打印输出T的值
g=im2bw(f,T/255);
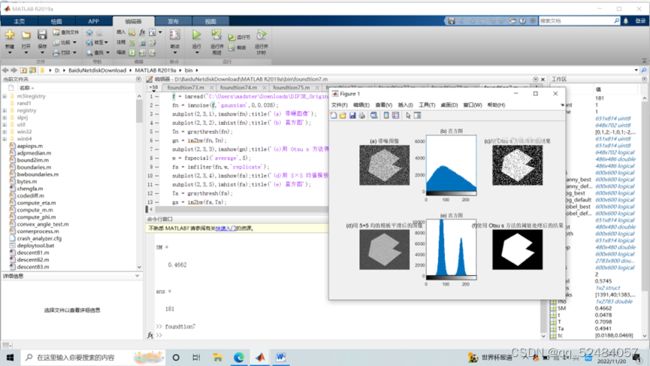
figure;subplot(1,3,1);imshow(f);title('(a)带噪声的指纹');
subplot(1,3,2);imhist(f);title('(b)直方图');
subplot(1,3,3);imshow(g);title('(c)用全局阈值分割的结果');
7.8
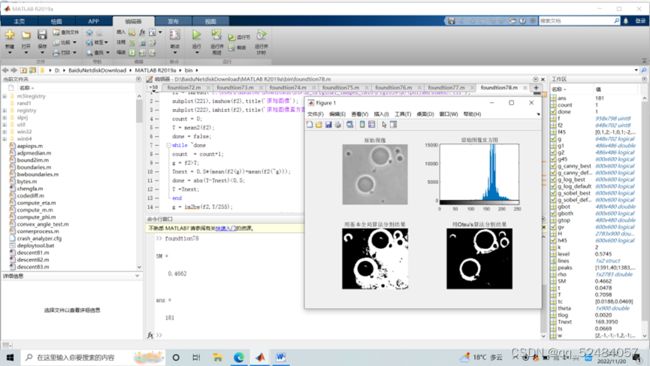
f2 = imread('路径');
subplot(221),imshow(f2),title('原始图像');
subplot(222),imhist(f2),title('原始图像直方图');
count = 0;
T = mean2(f2);
done = false;
while ~done
count  = count+1;
g = f2>T;
Tnext = 0.5*(mean(f2(g))+mean(f2(~g)));
done = abs(T-Tnext)<0.5;
T =Tnext;
end
g = im2bw(f2,T/255);
subplot(223),imshow(g,[]),title('用基本全局算法分割结果')
[T,SM] = graythresh(f2);
SM
T*255
g = im2bw(f2,T);
subplot(224),imshow(g),title('用Otsu’s算法分割结果')
7.9
f = tofloat(imread('路径'));
subplot(231),imshow(f),title('原图像');
subplot(232),imhist(f),title('原图像直方图');
sx = fspecial('sobel');
sy = sx';
gx = imfilter(f,sx,'replicate');
gy = imfilter(f,sy,'replicate');
grad = sqrt(gx.*gx+gy.*gy);
grad = grad/max(grad(:));

h =imhist(grad);
Q = percentile2i(h,0.999);

markerImage = grad>Q;
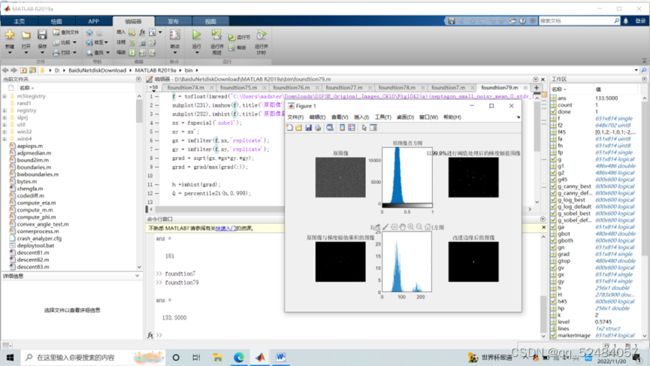
subplot(233),imshow(markerImage),title('以99.9%进行阈值处理后的梯度幅值图像');
fp = f.*markerImage;
subplot(234),imshow(fp),title('原图像与梯度幅值乘积的图像');
hp = imhist(fp);
hp(1) = 0;
subplot(235),bar(hp),title('原图像与梯度幅值乘积的直方图');
T = otsuthresh(hp);
T*(numel(hp)-1)
g = im2bw(f,T);
subplot(236),imshow(g),title('改进边缘后的图像')
7.10
f = tofloat(imread('路径'));
subplot(231),imshow(f),title('原始图像');
subplot(232),imhist(f),title('原始图像的直方图');
hf = imhist(f);
[Tf SMf] = graythresh(f);
gf = im2bw(f,Tf);
subplot(233),imshow(gf),title('对原始图像进行分割的图像');
w= [-1 -1 -1;-1 8 -1;-1 -1 -1];
lap = abs(imfilter(f,w,'replicate'));
lap = lap/max(lap(:));
h = imhist(lap);
Q = percentile2i(h,0.995);
markerImage = lap >Q;
fp = f.*markerImage;
subplot(234),imshow(fp),title('标记图像与原图像的乘积');
hp = imhist(fp);
hp(1) =0;
subplot(235),bar(hp)
T = otsuthresh(hp);
g = im2bw(f,T);
subplot(236),imshow(g),title('修改边缘后的阈值处理图像')
7.11
f = tofloat(imread('路径'));
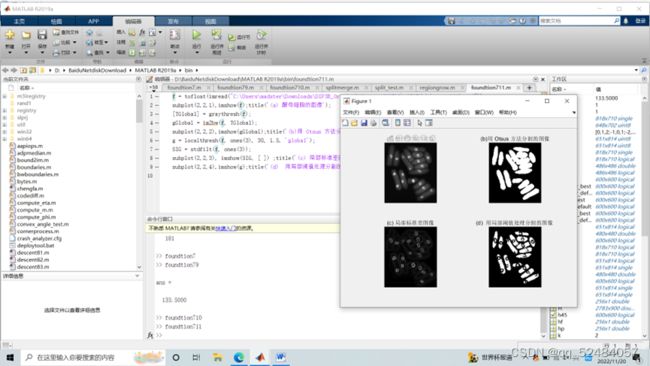
subplot(2,2,1),imshow(f);title('(a) 酵母细胞的图像');
[TGlobal] = graythresh(f);
gGlobal = im2bw(f, TGlobal);
subplot(2,2,2),imshow(gGlobal);title('(b)用 Otsus 方法分割的图像');
g = localthresh(f, ones(3), 30, 1.5, 'global');
SIG = stdfilt(f, ones(3));
subplot(2,2,3), imshow(SIG, [ ]) ;title('(c) 局部标准差图像');
subplot(2,2,4),imshow(g);title('(d)  用局部阈值处理分割的图像 ');
7.12
f = imread('路径');
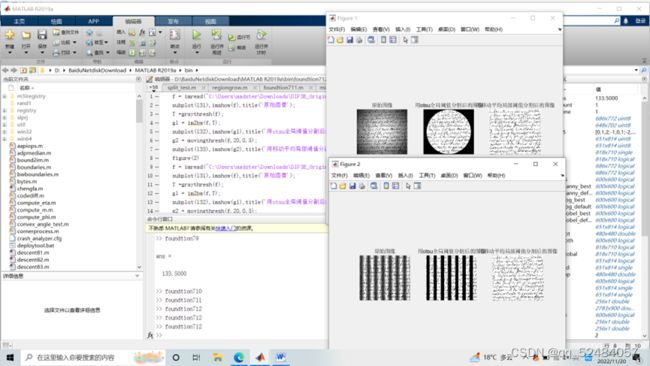
subplot(131),imshow(f),title('原始图像');
T =graythresh(f);
g1 = im2bw(f,T);
subplot(132),imshow(g1),title('用otsu全局阈值分割后的图像');
g2 = movingthresh(f,20,0.5);
subplot(133),imshow(g2),title('用移动平均局部阈值分割后的图像');
figure(2)
f = imread("C:\Users\madster\Downloads\DIP3E_Original_Images_CH10\Fig1050(a)(sine_shaded_text_image).tif");
subplot(131),imshow(f),title('原始图像');
T =graythresh(f);
g1 = im2bw(f,T);
subplot(132),imshow(g1),title('用otsu全局阈值分割后的图像');
g2 = movingthresh(f,20,0.5);
subplot(133),imshow(g2),title('用移动平均局部阈值分割后的图像');f = imread('路径');
subplot(2,2,1),imshow(f);
title('(a)显示有焊接缺陷的图像');
%函数regiongrow返回的NR为是不同区域的数目,参数SI是一副含有种子点的图像
%TI是包含在经过连通前通过阈值测试的像素
[g,NR,SI,TI]=regiongrow(f,1,0.26);%种子的像素值为255,65为阈值
subplot(2,2,2),imshow(SI);
title('(b)种子点');
subplot(2,2,3),imshow(TI);
title('(c)通过了阈值测试的像素的二值图像(白色)');
subplot(2,2,4),imshow(g);
title('(d)对种子点进行8连通分析后的结果');
7.14
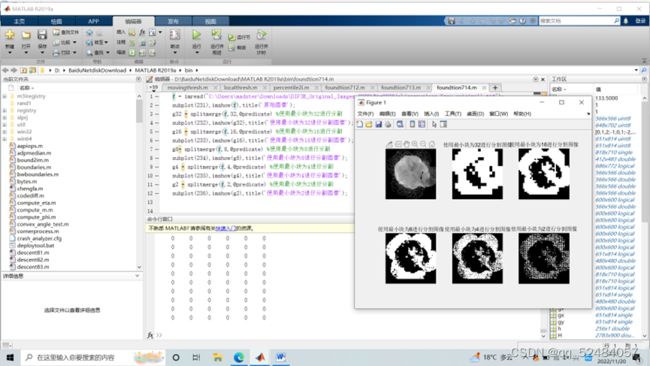
f = imread('路径');
subplot(231),imshow(f),title('原始图像');
g32 = splitmerge(f,32,@predicate); %使用最小块为32进行分割
subplot(232),imshow(g32),title('使用最小块为32进行分割图像');
g16 = splitmerge(f,16,@predicate); %使用最小块为16进行分割
subplot(233),imshow(g16),title('使用最小块为16进行分割图像');
g8= splitmerge(f,8,@predicate); %使用最小块为8进行分割
subplot(234),imshow(g8),title('使用最小块为8进行分割图像');
g4 = splitmerge(f,4,@predicate); %使用最小块为4进行分割
subplot(235),imshow(g4),title('使用最小块为4进行分割图像');
g2 = splitmerge(f,2,@predicate); %使用最小块为2进行分割
subplot(236),imshow(g2),title('使用最小块为2进行分割图像');
7.15
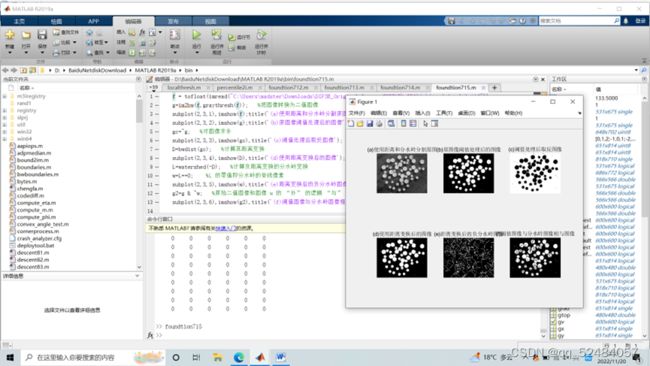
f = tofloat(imread('路径'));
g=im2bw(f,graythresh(f));   %把图像转换为二值图像
subplot(2,3,1),imshow(f);title('(a)使用距离和分水岭分割原图');
subplot(2,3,2),imshow(g);title('(b)原图像阈值处理后的图像');
gc=~g;   %对图像求补
subplot(2,3,3),imshow(gc),title('(c)阈值处理后取反图像');
D=bwdist(gc);   %计算其距离变换
subplot(2,3,4),imshow(D),title('(d)使用距离变换后的图像');
L=watershed(-D);   %计算负距离变换的分水岭变换
w=L==0;    %L 的零值即分水岭的脊线像素
subplot(2,3,5),imshow(w),title('(e)距离变换后的负分水岭图像');
g2=g & ~w;   %原始二值图像和图像 w 的 “补” 的逻辑 “与” 操作可完成分割
subplot(2,3,6),imshow(g2),title('(f)阈值图像与分水岭图像相与图像');
7.16
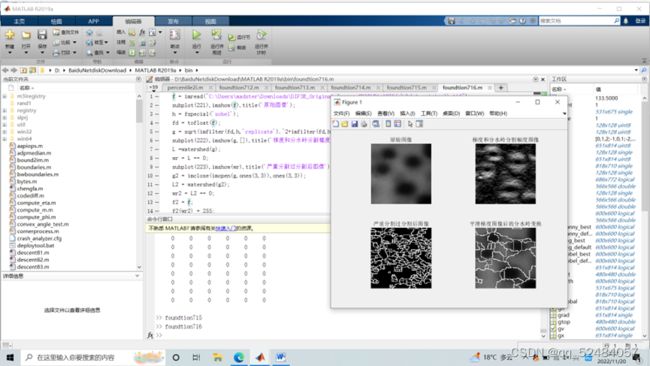
f = imread('路径');
subplot(221),imshow(f),title('原始图像');
h = fspecial('sobel');
fd = tofloat(f);
g = sqrt(imfilter(fd,h,'replicate').^2+imfilter(fd,h,'replicate').^2);
subplot(222),imshow(g,[]),title('梯度和分水岭分割幅度图像');
L =watershed(g);
wr = L == 0;
subplot(223),imshow(wr),title('严重分割过分割后图像');
g2 = imclose(imopen(g,ones(3,3)),ones(3,3));
L2 = watershed(g2);
wr2 = L2 == 0;
f2 = f;
f2(wr2) = 255;
subplot(224),imshow(f2),title('平滑梯度图像后的分水岭变换');
7.17
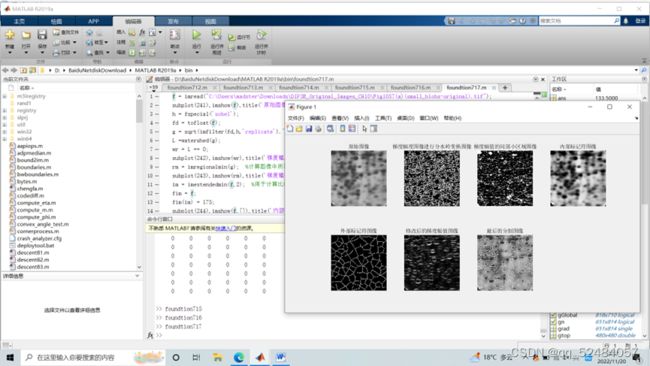
f = imread('路径');
subplot(241),imshow(f),title('原始图像');
h = fspecial('sobel');
fd = tofloat(f);
g = sqrt(imfilter(fd,h,'replicate').^2+imfilter(fd,h,'replicate').^2);
L =watershed(g);
wr = L == 0;
subplot(242),imshow(wr),title('梯度幅度图像进行分水岭变换图像');
rm = imregionalmin(g);  %计算图像中所有的局部小区域的位置
subplot(243),imshow(rm),title('梯度幅值的局部小区域图像');
im = imextendedmin(f,2);  %用于计算比临近点更暗的图像中“低点”的集合
fim = f;
fim(im) = 175;
subplot(244),imshow(f,[]),title('内部标记符图像');
Lim = watershed(bwdist(im));
em = Lim == 0;
subplot(245),imshow(em,[]),title('外部标记符图像');
g2 = imimposemin(g,im|em);  %用来修改一幅图像,使得其只在指定的位置处取得局部最小值
subplot(246),imshow(g2),title('修改后的梯度幅值图像');
L2 = watershed(g2);
f2 = f;
f2(L2 == 0) = 255;
subplot(247),imshow(f2),title('最后的分割图像');
