K-means聚类实验/Python
一、实验目标:
对cluster.dat中的二维点对进行聚类分析。
二、本次实验方法:
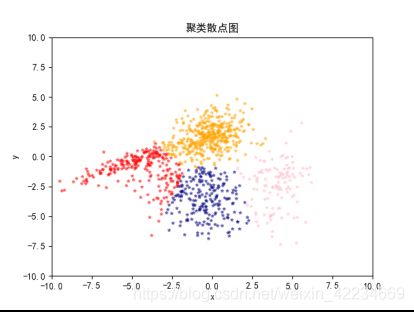
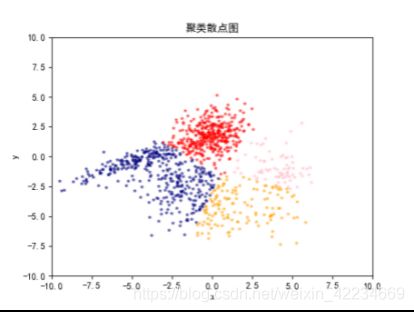
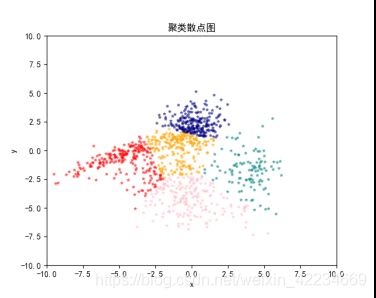
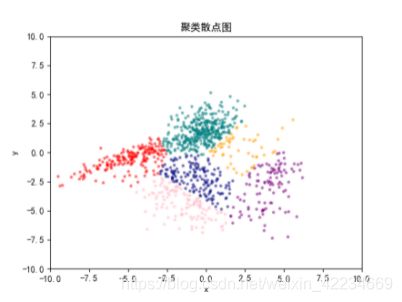
采用K-Means模型进行聚类,将聚类结果图示表达,用颜色区分不同簇的点,分析不同K值下的聚类结果,使用的编程语言为Python。
三、算法原理:
K-Means算法的目标是将原始数据分为K簇,每一簇都有一个中心点,这也是簇中点的均值点,簇中所有的点到所属的簇的中心点的距离都比到其他簇的中心点更近。
四、算法流程:
- 随机确定K个点作为质心(在本次实验中,我在数据中使用随机数选择了K个点作为初始质心)
- 找到离每个点最近的质心,将这个点分配到这个质心代表的簇里
- 再对每个簇进行计算,以点簇的均值点作为新的质心
- 如果新的质心和上一轮的不一样,则迭代进行2-3步骤,直到质心位置稳定
五、不同K值下的聚类结果图示:
六、测试方法:
使用量化的误差指标:误差平方和SSE(sum of the squared errors),来评价算法的结果。

使用此函数来计算结果的SSE。
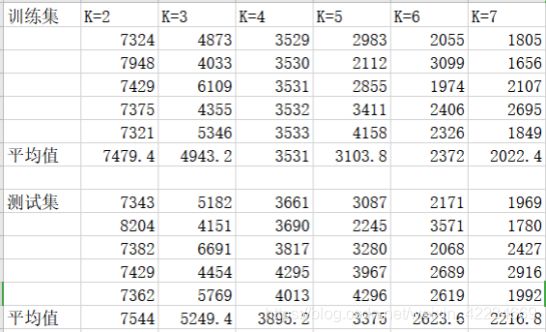
每次K取不同值时,记录5次数据集和训练集的SSE,取平均值,可以得到如下表格。
画出图示:
由左至右k=2,3,4,5,6,7,SSE会随着K的变大而减小。可以看出在k=4之后,随着k的增大,SSE的下降减缓了,再增加K得到的聚合回报变小,也就是k=4应该为最佳聚类数。
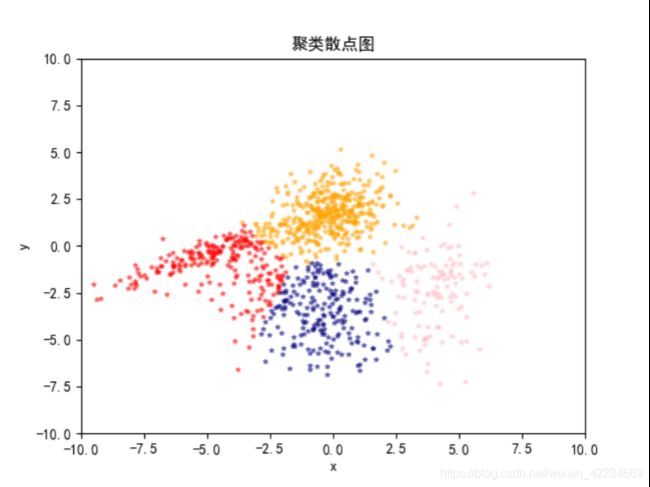
结合上一部分的图像,可以看到当K=3时,数据点的分类其实是不充分的。而当K=5时,数据点上方十分密集的数据点却经常因为右上角噪音点的影响被从中间分成两簇,这是不符合实际情况的,当k>5时,聚类结果就会显得愈加杂乱。结合图像,K=4仍然是最好的选择。
下图是我相对满意的聚类结果图:
七、实验总结
K-Means是机器学习聚类中的经典算法。虽然它有一些缺点:依赖于原始质心、会陷入局部最优的情况、对噪音和异常点比较敏感,但在我看来,它的可解释程度、通俗易懂程度,是十分出色的,整个算法没有复杂的点。这次实验对我的挑战性在于编程语言:Python。在这之前我对Python是陌生的,在断断续续编码的几天过程中,边完善算法,边学习编程语言,虽然也有大大小小的问题,最后都成功解决了,能打印出聚类的结果图的时候还是很有满足感得。聚类是个很有趣的问题!
八、源代码
import numpy as np
import math
import pandas as pd
from numpy import *
import matplotlib.pyplot as plt
import random
import operator
plt.rcParams["font.sans-serif"]=["SimHei"]
plt.rcParams["axes.unicode_minus"]=False

fo=open("cluster.dat")
DataSet=[]
while True:
    line=fo.readline()
    if not line:
        break            #读取结束就跳出
    lines=line.split()
    for i in lines:
        DataSet.append(float(i))
#print(DataSet)

PairSet=[]        #将数据转换成二维点对形式
for i in range(len(DataSet)):
    if i%2==0:
        TempPair=[DataSet[i],DataSet[i+1]]
        PairSet.append(TempPair)    #这里一定要注意缩进

#print(PairSet)

def Dis(pointA,pointB):            #计算距离的平方
    a=[pointA[i]-pointB[i] for i in range(0,2)]
    return a[0]*a[0]+a[1]*a[1]


def CreateCent(PairSet,k):  #随机选择k个点做初始质心
    centre=[]
    for i in range(0,k):
        j=random.randint(0,len(PairSet))
        centre.append(PairSet[j])
    #print("cen:",centre)
    return centre

#a=CreateCent(PairSet,10)
#print("cent:",a)

def Figure(PrintSet,k):    #一次打印所有的点
    fig=plt.figure()
    fig.add_subplot(1,1,1)
#画散点图的函数scatter(其中XY表示数值的大小,s表示散点的尺寸大小,c表示颜色,alpha表示透明度)
#plt.xlim(-10,10),plt.xticks([]) #x和y坐标轴的范围
#plt.ylim(-10,10),plt.yticks([]) #x和y坐标轴的范围

    color=['orange','navy','pink','#FF0000','teal','#800080','#FA8072','#2E8B57']
    for i in range(0,k):
        #print(i)
        for j in range(0,len(PrintSet[i])):
            plt.scatter(PrintSet[i][j][0],PrintSet[i][j][1],s=10,c=color[i],marker="*",alpha=.45)
    plt.axis([-10,10,-10,10]) #显示所有图像范围
    plt.title("聚类散点图")
    plt.xlabel("x")
    plt.ylabel("y")
    plt.show()

    return
#Figure(PairSet,11)

def classify(PairSet,cent,k):
    GroupSet=[[]for i in range(k)]
#    set[0].append(3)
    minDis=1000.0

    for i in range(0,len(PairSet)):
        for j in range(0,k):
            #print(j)
            distance=Dis(PairSet[i],cent[j])
            #print(distance)
            #print(minDis)
            if distance<minDis:
                minDis=distance
                loc=j
        #print("loc:",loc)
        #print("kkkkk",minDis)
        GroupSet[loc].append(PairSet[i])
        minDis=1000.0
#    print(set)
    return GroupSet


def upgradeCent(k,GroupSet):   #重新计算聚类中心点

    newCent=[]
    for i in range(0,k):  #K组
        sumX=0.0
        sumY=0.0
        count=len(GroupSet[i])
        for j in range(0,count):#    计算每一组的中心点
            sumX+=GroupSet[i][j][0]
            sumY+=GroupSet[i][j][1]
        newX=sumX/count
        newY=sumY/count
        newCent.append([newX,newY])

    return newCent

TrainSet=[]
TestSet=[]
InTrainSet=[0 for i in range(1000)]
i=0
while i<800:
    j=random.randint(0,999)
    if InTrainSet[j]==0:
        TrainSet.append(PairSet[j])
        InTrainSet[j]=1  #标志着被选中了
        i+=1

for i in range(999):
    if InTrainSet[i]==0:
        TestSet.append(PairSet[i])


def Interate(inputSet,Cent,k):
    #classify(PairSet,initCent,k)
    GroupSet=classify(TrainSet,Cent,k)  #切记还要用原来的pair重新分组
    newCent=upgradeCent(k,GroupSet)
    #print(newCent)
    if Cent!=newCent:
        Interate(GroupSet,newCent,k)
    return GroupSet


def cluster(k):
    initCent=CreateCent(TrainSet,k)
    initSet=classify(TrainSet,initCent,k)
    initCent=upgradeCent(k,initSet)
    #Figure(initSet,k)

    finalSet=Interate(initSet,initCent,k)  #传入第一次分好类的组、质心和k
    Figure(finalSet,k)
    return finalSet

def SSE(Set,Cent):
    sse=0.0
    for j in range(0,len(Cent)):    #计算每一簇的SSE再相加
        for i in range(0,len(Set[j])):
            sse+=Dis(Set[j][i],Cent[j])
    return sse


for i in range(5):
    k=4

    finalSet=cluster(k)
    finalCent=upgradeCent(k,finalSet)
    sse=SSE(finalSet,finalCent)
    print("训练集:",sse)

    TestfinalSet=classify(TestSet,finalCent,k)
    finalCent=upgradeCent(k,TestfinalSet)
    sse=SSE(finalSet,finalCent)
    print("测试集:",sse)


