2023 LIGHTGBM 深度学习方法使用简易教程 入坑向
一、需求背景及问题
项目要求使用LIGHTGBM进行本地数据的回归处理预测并要求做出Factors Importance的可视化处理
二、使用详情
1. LIGHTGBM框架使用目的
-
使用LIGHTGBM处理factors数据并作出regression预测
-
通过LIGHTGBM的python的接口查看在训练过程中factors的单个重要性
2. 环境配置
-
安装教程
-
先决条件:
-
Visual Studio 2022 或 2019
-
Python 3.9
-
-
Python配置库:
-
Lightgbm
-
Pands
-
Matplotlib
-
Sklearn
-
-
# coding: utf-8
from pathlib import Path

import pandas as pd
from sklearn.model_selection import train_test_split
import lightgbm as lgb

if lgb.compat.MATPLOTLIB_INSTALLED:
    import matplotlib.pyplot as plt
else:
    raise ImportError('You need to install matplotlib and restart your session for plot_example.py.')
三、现有框架结构及功能
1. 数据读取
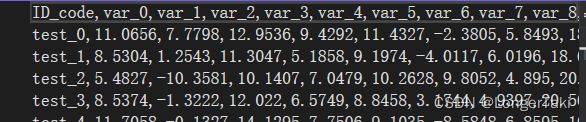
本地保存为csv格式train文档
带有headers的columns
代码:
# load or create your dataset

print('Loading data...')

regression_example_dir = Path(__file__).absolute().parents[1] / 'regression'

df_train = pd.read_csv(regression_example_dir/'train.csv')

# obtain the factors names list

factors_col = [f for f in df_train.columns if f not in ['Label']]

print('Data loading complete')
2. 转换数据
将数据按照50%比例分为训练集和测试集
代码
# seperate factors and label

X=df_train2.loc[:,factors_col]

y=df_train2.loc[:,'Label']

# split the data to train and test data

X_train , X_test, y_train, y_test = train_test_split(X,y,test_size = 0.5)

X_train.shape, X_test.shape, y_train.shape, y_test.shape

train_data = lgb.Dataset(X_train,label = y_train)

test_data = lgb.Dataset(X_test,label = y_test)
3. 配置LightGBM方法参数
参考lightgbmcontrol.csv
Parameters,Value
NumberOfIterations,500
LearningRate,0.05
NumberOfLeaves,160
MinimumExampleCountPerLeaf,300
L2Regularization,0
L1Regularization,0.005
# specify your configurations as a dict
params = {
    'num_leaves': 160,
    'MinimumExampleCountPerLeaf':300,
    'L2Regularization': 0,
    'num_iterations': 1000,
    'L1Regularization':0.005,
    'leaning_rate':0.05
}
4. 模型训练
测试回合数:500
gbm = lgb.train(

params,

train_data,

num_boost_round=500,

valid_sets=[train_data, test_data],

feature_name=[f'{i}' for i in factors_col],

categorical_feature=[30]

)
5. 评估模型
查看与评估结果的标准差‘l1’
evals_result = {} # to record eval results for plotting

callbacks=[

lgb.log_evaluation(30),

lgb.record_evaluation(evals_result)

]

print('Plotting metrics recorded during training...')

ax = lgb.plot_metric(evals_result)

plt.show()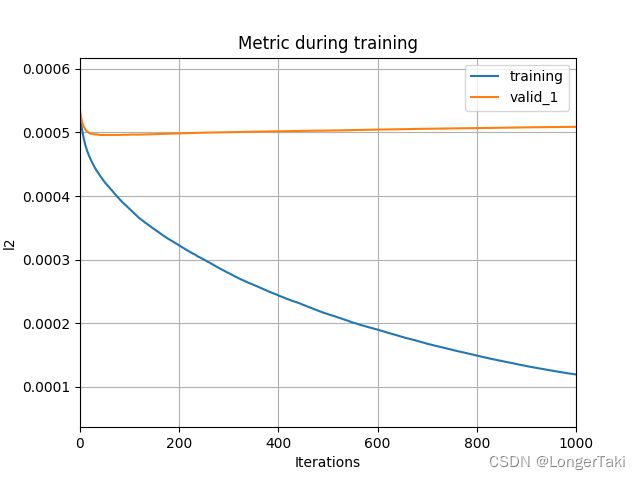
6.查看模型预测中的factors importance
print('Plotting feature importances...')

ax = lgb.plot_importance(gbm, max_num_features=30)

plt.show()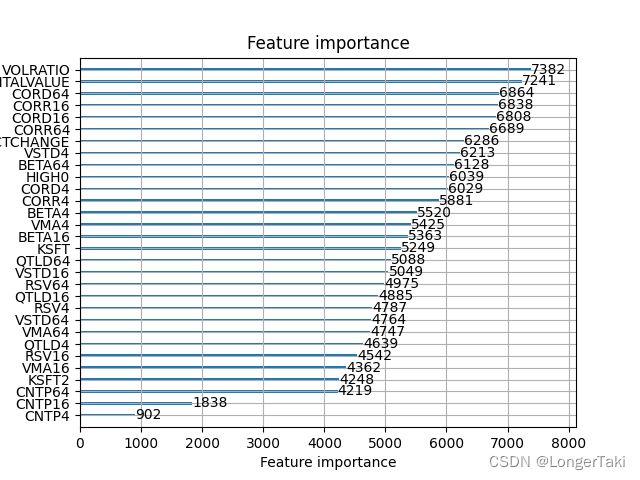
四、后续补充以及调参方向
哎先写到这里吧 有人看我再补充如何优化和调参