python用matplotlib画球_用Python的Matplotlib 画一个足球场
我们可能想要在图表上绘制线条或圆圈的原因有很多。 我们可以寻找添加平均线,突出显示关键数据点甚至绘制图片。
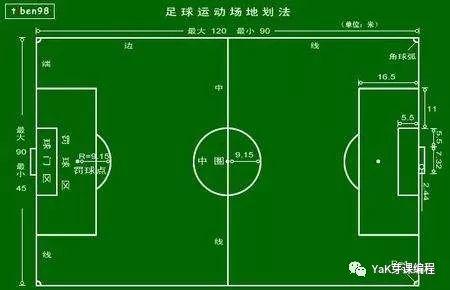
本文将展示如何使用足球场地图的示例添加线条,圆圈和圆弧,然后可以使用它来显示热图,传球或比赛期间发生的任何其他内容。
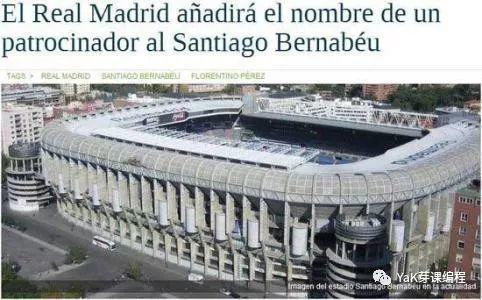
球场是神圣的。伯纳乌,圣西罗,安联球场,老特拉福德等等球场是球迷的圣地。在这里有一次次精彩的对决。
今天我们用Python的画图工具Matplotlib 画一个足球场。
In [1]:
import matplotlib.pyplot as pltfrom matplotlib.patches import Arc
Drawing Lines 画线
对于我们来说,最简单的方法是在球场外围开始。
一旦我们使用代码的前两行创建绘图,使用’plot’绘制线条非常简单。
您可能已经看到’plot’用于显示散点,但是为了绘制一条线,我们只需要提供两个列表作为参数,matplotlib将为我们思考:
List one: starting and ending X locations
List two: starting and ending Y locations
In [2]:
fig=plt.figure()ax=fig.add_subplot(1,1,1)plt.plot([0,0],[0,90],color="blue")plt.plot([0,130],[90,90], color="orange")plt.plot([130,130],[90,0], color="green")plt.plot([130,0],[0,0], color="red")plt.plot([65,65],[0,90], color="pink")plt.show()
做得好! Matplotlib使绘图线非常容易,只需要对开始和结束位置进行一些清晰的思考即可绘制它们。
Drawing Circles画圆
接下来,我们将在球场上绘制一些圆圈。 首先,我们需要一个中心圆,而且我们还需要中心和罚点的标记。
添加圆圈与线条略有不同。 首先,我们需要将圆圈分配给变量。
我们使用’circle’来做这件事,传递两个基本参数:
X/Y coordinates of the middle of the circle
Radius of the circle
In [3]:
#Create figurefig=plt.figure()ax=fig.add_subplot(1,1,1)plt.plot([0,0],[0,90],
color="black")plt.plot([0,130],[90,90],
color="black")plt.plot([130,130],[90,0],
color="black")plt.plot([130,0],[0,0],
color="black")plt.plot([65,65],[0,90],
color="black")#Assign circles to variablescentreCircle = plt.Circle((65,45),9.15,color="red",fill=False)centreSpot = plt.Circle((65,45),0.8,color="blue")ax.add_patch(centreCircle)ax.add_patch(centreSpot)plt.show()
Drawing Arcs 画弧
既然你可以创建圆圈,弧线也会一样容易 – 我们需要它们用于禁区外的线条。 虽然他们采取了更多的参数,但他们遵循与以前相同的模式。 让我们来看看这些参数:
X/Y coordinates of the centrepoint of the arc, assuming the arc was a complete shape.
Width – we must pass width and height as the arc might not be a circle, it might instead be from an oval shape
Height – as above
Angle – degree rotation of the shape (anti-clockwise)
Theta1 – start location of the arc, in degrees
Theta2 – end location of the arc, in degrees
In [4]:
fig=plt.figure()ax=fig.add_subplot(1,1,1)Lineplt.plot([0,0],[0,90],
color="black")plt.plot([0,130],[90,90],
color="black")plt.plot([130,130],[90,0],
color="black")plt.plot([130,0],[0,0],
color="black")plt.plot([65,65],[0,90],
color="black")#Left Penalty Areaplt.plot([16.5,16.5],[65,25],color="black")plt.plot([0,16.5],[65,65],color="black")plt.plot([16.5,0],[25,25],color="black")#Centre Circle/SpotcentreCircle = plt.Circle((65,45),9.15,fill=False)centreSpot = plt.Circle((65,45),0.8)ax.add_patch(centreCircle)ax.add_patch(centreSpot)leftArc = Arc((11,45),height=18.3,width=18.3,angle=0,theta1=310,theta2=50,color="red")ax.add_patch(leftArc)plt.show()
合成所有的代码
我们用个函数实现所有的代码;
In [5]:
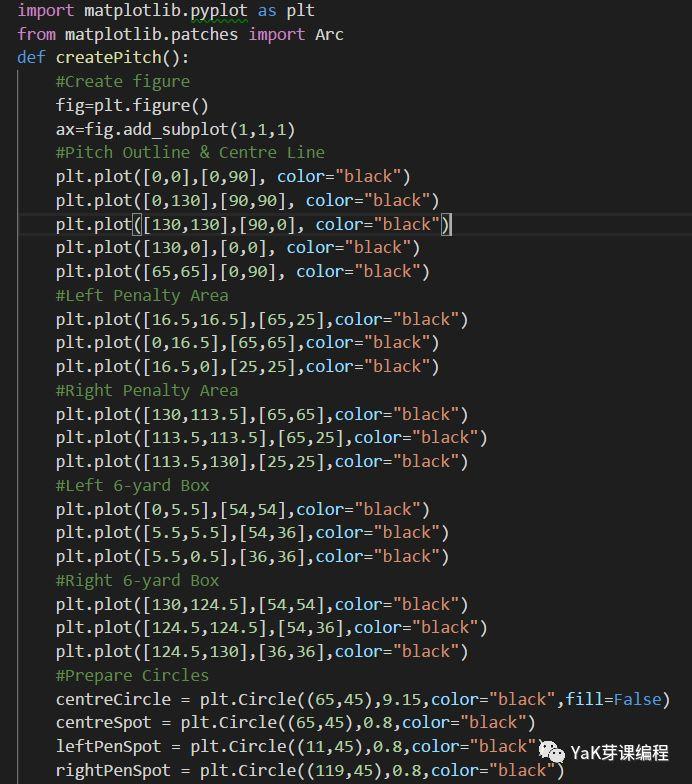
def createPitch():
#Create figure
fig=plt.figure()
ax=fig.add_subplot(1,1,1)
#Pitch Outline & Centre Line
plt.plot([0,0],[0,90], color="black")
plt.plot([0,130],[90,90], color="black")
plt.plot([130,130],[90,0], color="black")
plt.plot([130,0],[0,0], color="black")
plt.plot([65,65],[0,90], color="black")
#Left Penalty Area
plt.plot([16.5,16.5],[65,25],color="black")
plt.plot([0,16.5],[65,65],color="black")
plt.plot([16.5,0],[25,25],color="black")
#Right Penalty Area
plt.plot([130,113.5],[65,65],color="black")
plt.plot([113.5,113.5],[65,25],color="black")
plt.plot([113.5,130],[25,25],color="black")
#Left 6-yard Box
plt.plot([0,5.5],[54,54],color="black")
plt.plot([5.5,5.5],[54,36],color="black")
plt.plot([5.5,0.5],[36,36],color="black")
#Right 6-yard Box
plt.plot([130,124.5],[54,54],color="black")
plt.plot([124.5,124.5],[54,36],color="black")
plt.plot([124.5,130],[36,36],color="black")
#Prepare Circles
centreCircle = plt.Circle((65,45),9.15,color="black",fill=False)
centreSpot = plt.Circle((65,45),0.8,color="black")
leftPenSpot = plt.Circle((11,45),0.8,color="black")
rightPenSpot = plt.Circle((119,45),0.8,color="black")
#Draw Circles
ax.add_patch(centreCircle)
ax.add_patch(centreSpot)
ax.add_patch(leftPenSpot)
ax.add_patch(rightPenSpot)
#Prepare Arcs
leftArc = Arc((11,45),height=18.3,width=18.3,angle=0,theta1=310,theta2=50,color="black")
rightArc = Arc((119,45),height=18.3,width=18.3,angle=0,theta1=130,theta2=230,color="black")
#Draw Arcs
ax.add_patch(leftArc)
ax.add_patch(rightArc)
#Tidy Axes
plt.axis('off')
#Display Pitch
plt.show()
createPitch()
总结:
在我们的文章中,我们已经看到了如何在Matplotlib中绘制线条,圆弧和圆圈。 在尝试使用注释向任何绘图添加最后润色时,您会发现这很有用。 在绘制我们将在其上绘制数据的地图时,这些工具同样重要 – 就像我们的地图示例一样。
转自公众号:
YaK芽课


