MATLAB中调整图像间距,并将多条曲线放于一个figure中
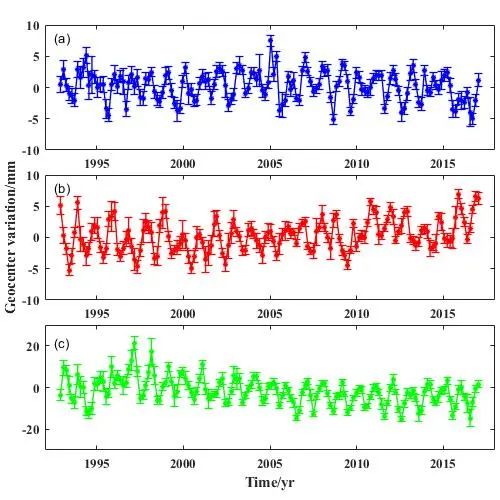
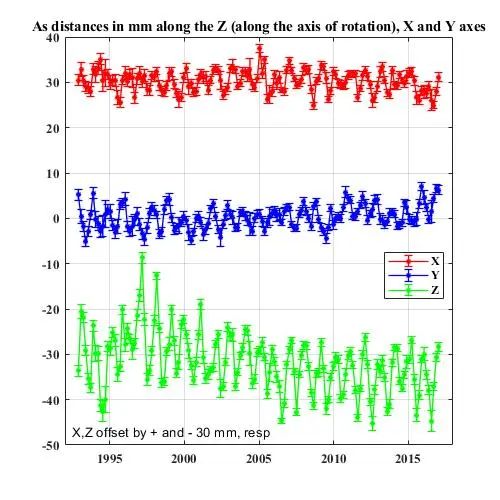
The spherical harmonic coefficients of degree 1 represent the distance between the center of mass of the Earth and its 'center of figure'【球谐一阶项代表了地球形状中心和地球质量中心之间的距离】, which in practice is approximated by the center of a set of tracking stations on the surface of the Earth【确定地球形状中心通常是在地表设置一系列跟踪站,这些站点所确定的中心为地球的形状中心】. Because of their physical meaning, time changes in degree 1 coefficients can be expressed in several equivalent forms
As distances in mm along the Z (along the axis of rotation), X and Y axes;
As (fully normalized) coefficients of the geopotential;
As the changes in mass (per unit area) that would give rise to the geopotential coefficients, expressed either in kg/m^2 or cm of equivalent water thickness.
此处我们可视化第一类表达方式。我们打开GRACE数据,我们可以发现一阶项是0,这是因为在解算数据时,默认为地球的质量中心,而我们在研究中通常采用地球的形状中心,因而两者存在差异,需要补充一阶项。
我们在这个网站可以下载以X,Y,Z形式表达的一阶项的长时间变化https://filedrop.csr.utexas.edu/pub/slr/geocenter/
% download degree one data from:https://filedrop.csr.utexas.edu/pub/slr/geocenter/
load('d1.txt')
x = d1(:,1);
y = d1(:,2);
err = d1(:,5);

set(gcf,'position',[500,500,500,500])

subplot('Position',[0.09,0.70,0.9,0.25])
title('As distances in mm along the Z (along the axis of rotation), X and Y axes')
errorbar(x,y,err,'-*b','LineWidth',1','MarkerSize',4)
text(1992.5,8,'(a)')
set(gca,'fontsize',10,'fontweight','bold','FontName','Times New Roman','XLim',[1992,2018],'YLim',[-10,10]);
subplot('Position',[0.09,0.4,0.9,0.25])

y1 = d1(:,3);
err1 = d1(:,6);
errorbar(x,y1,err1,'-*r','LineWidth',1','MarkerSize',4)
text(1992.5,8,'(b)')
ylabel('Geocenter variation/mm');
set(gca,'fontsize',10,'fontweight','bold','FontName','Times New Roman','XLim',[1992,2018],'YLim',[-10,10]);

subplot('Position',[0.09,0.1,0.9,0.25])
y2 = d1(:,4);
err2 = d1(:,7);
errorbar(x,y2,err2,'-*g','LineWidth',1','MarkerSize',4)
text(1992.5,22,'(c)')
xlabel('Time/yr');
set(gca,'fontsize',10,'fontweight','bold','FontName','Times New Roman','XLim',[1992,2018],'YLim',[-30,30]);

figure
set(gcf,'position',[500,500,500,500])
errorbar(x,y+30,err,'-*r','LineWidth',1','MarkerSize',4)
hold on
errorbar(x,y1,err,'-*b','LineWidth',1','MarkerSize',4)
errorbar(x,y2-30,err,'-*g','LineWidth',1','MarkerSize',4)
set(gca,'fontsize',10,'fontweight','bold','FontName','Times New Roman','XLim',[1992,2018],'YLim',[-50,40]);
legend('X','Y','Z','Location','Best')
text(1992.5,-47,'X,Z offset by + and - 30 mm, resp')
grid on
title('As distances in mm along the Z (along the axis of rotation), X and Y axes')
显示的结果如下图:


