R语言聚类分析——代码解析
+(1)实验数据:iris鸢尾花数据
datd(iris)
head(iris)
Sepal.Length Sepal.Width Petal.Length Petal.Width Species
1 5.1 3.5 1.4 0.2 setosa
2 4.9 3.0 1.4 0.2 setosa
3 4.7 3.2 1.3 0.2 setosa
4 4.6 3.1 1.5 0.2 setosa
5 5.0 3.6 1.4 0.2 setosa
6 5.4 3.9 1.7 0.4 setosa
data()函数载入数据集
head()函数查看前几行数据,括号内填前多少行,默认6行
table(iris$Species)
setosa versicolor virginica
50 50 50
table()函数查看"Species"三种值出现的次数
set.seed(1234)
kmeansObj <-kmeans(iris[,-5],centers=3)
print(kmeansObj)
K-means clustering with 3 clusters of sizes 50, 62, 38
Cluster means:
Sepal.Length Sepal.Width Petal.Length Petal.Width
1 5.006000 3.428000 1.462000 0.246000
2 5.901613 2.748387 4.393548 1.433871
3 6.850000 3.073684 5.742105 2.071053
Clustering vector:
[1] 1 1 1 1 1 1 1 1 1 1 1 1 1 1 1 1 1 1 1 1 1 1 1 1 1 1 1 1 1 1 1 1 1 1 1 1
[37] 1 1 1 1 1 1 1 1 1 1 1 1 1 1 2 2 3 2 2 2 2 2 2 2 2 2 2 2 2 2 2 2 2 2 2 2
[73] 2 2 2 2 2 3 2 2 2 2 2 2 2 2 2 2 2 2 2 2 2 2 2 2 2 2 2 2 3 2 3 3 3 3 2 3
[109] 3 3 3 3 3 2 2 3 3 3 3 2 3 2 3 2 3 3 2 2 3 3 3 3 3 2 3 3 3 3 2 3 3 3 2 3
[145] 3 3 2 3 3 2
Within cluster sum of squares by cluster:
[1] 15.15100 39.82097 23.87947
(between_SS / total_SS = 88.4 %)
Available components:
[1] "cluster" "centers" "totss" "withinss"
[5] "tot.withinss" "betweenss" "size" "iter"
[9] "ifault"
set.seed(1234):设置随机数种子,使得实验结果可复制。括号内的数值是随意的,就是对抽取的随机数进行标记。在下一次可抽取出相同的样本。
kmeans():做K均值聚类。
第一个参数,是数据集,这里使用切片的方法来提取数据,这样可以去掉类别Species。
这里讲一下切片吧
df[,],默认所以,全部,[,]表示 [行,列]
df[1,],取第一行,所以列
df[,1],取所有行,第一列
df[-1,],删取第一行后,再取所有的列
df[,-1],删除第一列后,再取所有的行
第二个参数centers,表示簇的数量,即多少类,设置为3
其他参数在最后介绍
下面对输出的结果进行解析:
(1)K-means clustering with 3 clusters of sizes 50, 62, 38
表示三组的K-均值聚类的分类情况,第一个类为50个样本,第二个有62个样本,第三有38个样本。
(2)Cluster means:
每个聚类中各个列值生成的最终平均值
(3)Clustering vector:
每行记录所属的聚类(2代表属于第二个聚类,1代表属于第一个聚类,3代表属于第三个聚类)
(4)Within cluster sum of squares by cluster:
每个聚类内部的距离平方和
(5)Available components:
运行kmeans函数返回的对象所包含的各个组成部分
(6)Available components:
运行kmeans函数返回的对象所包含的各个组成部分
部分的含义:
“cluster”是一个整数向量,用于表示记录所属的聚类
“centers”是一个矩阵,表示每聚类中各个变量的中心点
“totss”表示所生成聚类的总体距离平方和
“withinss”表示各个聚类组内的距离平方和
“tot.withinss”表示聚类组内的距离平方和总量
“betweenss”表示聚类组间的聚类平方和总量
“size”表示每个聚类组中成员的数量
那我们如何查看呢?
如:
kmeansObj$totss
kmeansObj$betweenss
即可进行查看
还有以上的数值是如何计算的呢?
(查过很多资料,都没有说是如何计算的,只有字面意思解释,那不行啊)
以上的案例数据太大不好介绍
接下来,我使用一个简单的数据集来解释,让字面意思更清晰
> df <- data.frame(x=c(0,0,1.5,5,5),y=c(2,0,0,0,2))
> km <- kmeans(df[,-2],centers=2)
> print(km)输出:
K-means clustering with 2 clusters of sizes 3, 2
Cluster means:
[,1]
1 0.5
2 5.0Clustering vector:
[1] 1 1 1 2 2Within cluster sum of squares by cluster:
[1] 1.5 0.0
(between_SS / total_SS = 94.2 %)Available components:
[1] "cluster" "centers" "totss" "withinss" "tot.withinss"
[6] "betweenss" "size" "iter" "ifault"> print(df)
x y
1 0.0 2
2 0.0 0
3 1.5 0
4 5.0 0
5 5.0 2解释:
K-means clustering with 2 clusters of sizes 3, 2
使用K-means算法以2为参数,把5个数据对象分为2个聚类,确保聚类具有较高的相似度,而聚类间的相似度较低。
首先使用欧几里得定理来分类:求出5个类的距离
1与2的距离:0
1与3的距离:1.5
1与4的距离:5
1与5的距离:5
2与3的距离:1.5
2与4的距离:5
2与5的距离:5
3与4的距离:3.5
3与5的距离:3.5
4与5的距离:0
要分成两类,所以1与2一类,4和5一类,3到1、2为1.5,到4、5为3.5,所以和1、2、一类
C1(1、2、3),C2(4,5)
Cluster means:
[,1]
1 0.5
2 5.0每个聚类中各个列值生成的最终平均值
Within cluster sum of squares by cluster:
[1] 1.5 0.0每个聚类内部的距离平方和
1.5:
什么意思呢?就是1、2相同到3的距离的平方和
0.0:4到5的距离为0
(4)评估k均值聚类结果
table(kmeansObj$cluster,iris$Species)
setosa versicolor virginica
1 50 0 0
2 0 48 14
3 0 2 36
这个与混淆矩阵差不多,差别是这里真实的是列的,预测的是行的
(5)可视化k均值聚类结果
par(mar=c(4,4,0.1,0.1))
plot(iris[c("Petal.Width","Sepal.Width")],col = kmeansObj$cluster)
points(kmeansObj$centers[,c("Petal.Width","Sepal.Width")],col =1:3,pch=8,cex=2)
par()函数设置绘图参数
mar参数:图形边距参数(下,左,上,右)
plot()函数画散点图
col参数:符号和颜色,这里把聚类放入表示表示三种颜色类型
points()添加点并设置属性
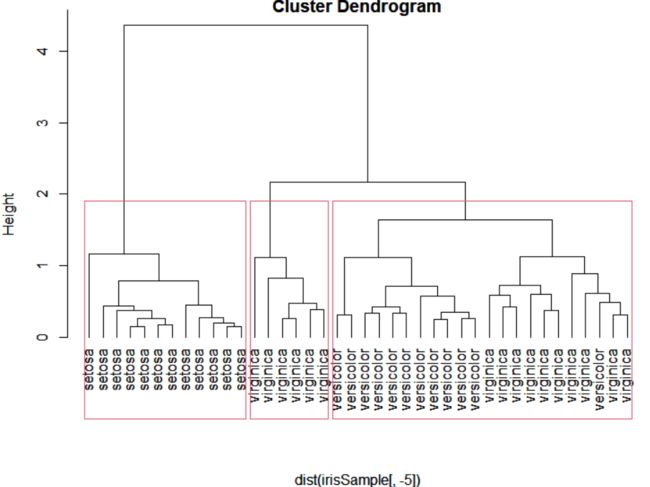
(6)做层次聚类
set.seed(1234)
idx <- sample(1:dim(iris)[1],40)
irisSample <-iris[idx,]
hc <-hclust(dist(irisSample[,-5]),method = "average")
print(hc)
Call:
hclust(d = dist(irisSample[, -5]), method = "average")
Cluster method : average
Distance : euclidean
Number of objects: 40 
groups <- cutree(hc,k = 3)
table(groups,iris$Species[idx])
groups setosa versicolor virginica
1 12 0 0
2 0 12 10
3 0 0 6
