机器学习案例——客户流失预测
1、项目简介
1) 数据说明:
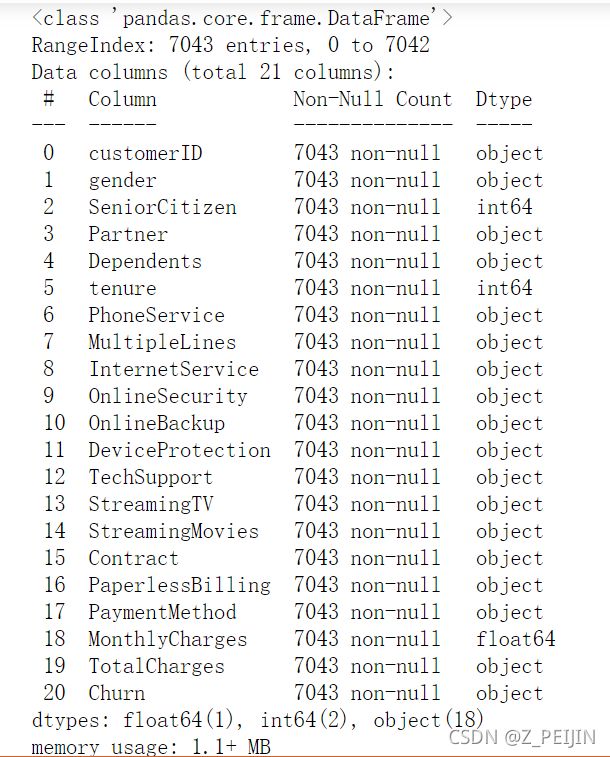
本数据集来自和鲸社区,共有7043条数据,共计21个字段数据包含以下字段:
- customerID :客户
- id gender : 性别
- SeniorCitizen : 是否为老年人,取值为0和1,0为否,1为是
- Partner : 是否拥有伴侣
- Dependents : 是否有家属
- tenure : 入网时长(月)
- PhoneService : 是否订阅电话服务
- MultipleLines: 是否有多条线路(是,否,没有电话服务)
- InternetService : 网络服务提供商(DSL,光纤,否)
- OnlineSecurity : 在线服务安全性(是,否,无网络服务)
- OnlineBackup : 在线备份服务(是,否,无网络服务)
- DeviceProtection :设备保护(是,否,无网络服务)
- TechSupport : 技术支持(是,否,无网络服务)
- StreamingTV :流媒体电视(是,否,无网络服务)
- StreamingMovies :流媒体电影(是,否,无网络服务)
- Contract :合同期限(每月,一年,两年)
- PaperlessBilling :是否无纸化账单(是,否)
- PaymentMethod :支付方式(电子支票,邮寄支票,银行自动转账,信用卡自动支付) - MonthlyCharges :每月收取费用
- TotalCharges :总收取费用
- Churn :是否流失
2)需求:
根据现有信息选择合适模型建模预测客户是否流失。
2、特征处理及选择
2.1、初步探索清洗
导入库并加载数据
# 导入常用库
import pandas as pd
import numpy as np
import matplotlib.pyplot as plt
import warnings
warnings.filterwarnings('ignore')
# 加载数据
data=pd.read_csv('tel_data.csv')
查看数据基本信息
data.info()
# 查看数据是否有重复值
data.duplicated().value_counts()
# 对数据做描述性统计,查看特征情况
data.describe([0.1,0.25,0.5,0.75,0.9]).T
# 分离特征变量和目标变量
x = data.iloc[:, :-1]
y = data.iloc[:, -1]
删除customerID
# 特征变量中的customerID 对目标变量没有影响,将其删去
x.drop(columns='customerID',inplace=True)
2.2、特征处理
1)处理分类变量
考虑后续建模采用树模型,对类别变量进行顺序编码。
from sklearn.preprocessing import OrdinalEncoder
# 取出类别变量列名
category_list = x.columns[x.dtypes=='object'].tolist()
# 进行顺序编码
x_cate_rfc = OrdinalEncoder().fit_transform(x.loc[:,category_list])
2)处理连续型变量
对连续型变量进行标准化
# 取出连续型变量的列
qualitative_list = x.columns.tolist()
for i in category_list:
    qualitative_list.remove(i)
ss = StandardScaler()
x_qualitative = ss.fit_transform(x.loc[:,qualitative_list])
3)处理目标变量
# 对标签进行编码
from sklearn.preprocessing import LabelEncoder
L_en = LabelEncoder()
L_en.fit(y)
y = pd.DataFrame(L_en.transform(y))
4)合并特征
将分类型特征和连续型特征进行合并,得到完整特征。
x_new_rfc = pd.concat([pd.DataFrame(x_qualitative),pd.DataFrame(x_cate_rfc)],axis=1)
3、构建模型
3.1、模型选择
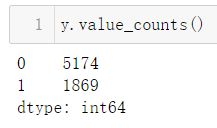
对目标变量进行统计,发现样本不均衡,故采用样本集成学习算法——BalancedRandomForestClassifier,即将一个不平衡数据集拆分成多个平衡的子集来实现数据均衡的目的,后续用这n份平衡的训练数据集分别训练一个基学习器,最终预测结果由n个基学习器来共同决定(对于分类,用少数服从多数投票;对于回归,取预测结果的平均值)。

3.2、模型构建
# 导入库
from imblearn.ensemble import BalancedRandomForestClassifier
from sklearn.model_selection import cross_validate
# 实例化模型
brfc = BalancedRandomForestClassifier(n_jobs=-1
                                     ,random_state=90)
# 采用交叉验证评估
score = cross_validate(brfc,x_new_rfc,y,cv=10,scoring=['precision_weighted','recall_weighted'])
prec = score['test_precision_weighted'].mean()
recall = score['test_recall_weighted'].mean()
print(f'查准率:{prec},召回率:{recall}')
3.3、模型调参
参数调节思路,按照参数对模型影响的重要程度依次调节。
1)n_estimators
利用学习曲线观察n_estimators在什么取值开始变得平稳,是否一直推动模型整体准确率的上升等信息,第一次的学习曲线,先用来帮助划定范围,取每十个数作为一个阶段,来观察n_estimators的变化如何引起模型整体准确率的变化。
prec_list = []
recall_list = []
for i in range(0,200,10):
    brfc = BalancedRandomForestClassifier(n_estimators=i+1,
                                 n_jobs=-1,
                                 random_state=90)
    score = cross_validate(brfc,x_new_rfc,y,cv=10,scoring=['precision_weighted','recall_weighted'])
    prec = score['test_precision_weighted'].mean()
    prec_list.append(prec)

    recall = score['test_recall_weighted'].mean()
    recall_list.append(recall)

print('查准率:',max(prec_list),(prec_list.index(max(prec_list))*10)+1)
print('召回率:',max(recall_list),(recall_list.index(max(recall_list))*10)+1)
plt.figure(figsize=[20,5])
plt.plot(range(1,201,10),prec_list,color="red",label="prec")
plt.plot(range(1,201,10),recall_list,color='blue',label='recall')
plt.legend()
plt.show()
prec_list = []
recall_list = []
for i in range(165,200,1):
    brfc = BalancedRandomForestClassifier(n_estimators=i+1
		                                 ,n_jobs=-1
		                                 ,random_state=90)
    score = cross_validate(brfc,x_new_rfc,y,cv=10,scoring=['precision_weighted','recall_weighted'])
    prec = score['test_precision_weighted'].mean()
    prec_list.append(prec)

    recall = score['test_recall_weighted'].mean()
    recall_list.append(recall)

print('查准率:', max(prec_list),([*range(165,200)][prec_list.index(max(prec_list))]))
print('召回率:', max(recall_list),([*range(165,200)][recall_list.index(max(recall_list))]))

plt.figure(figsize=[20,5])
plt.plot(range(165,200,1),prec_list,color="red",label="prec")
plt.plot(range(165,200,1),recall_list,color='blue',label='recall')
plt.legend()
plt.show()

通过学习曲线发现,当n_estimators取170时查准率最高,当n_estimators取167时召回率最高,此处取n_estimators为167
2)max_depth
设定n_estimators=167,画出关于max_depth的学习曲线
from sklearn.model_selection import cross_validate
prec_list = []
recall_list = []
for i in range(1,21):
    brfc = BalancedRandomForestClassifier(n_estimators=167
    									 ,max_depth=i
		                                 ,n_jobs=-1
		                                 ,random_state=90)

    score = cross_validate(brfc,x_new_rfc,y,cv=10,scoring=['precision_weighted','recall_weighted'])
    prec = score['test_precision_weighted'].mean()
    prec_list.append(prec)

    recall = score['test_recall_weighted'].mean()
    recall_list.append(recall)

print('查准率:', max(prec_list),([*range(1,21)][prec_list.index(max(prec_list))]))
print('召回率:', max(recall_list),([*range(1,21)][recall_list.index(max(recall_list))]))

plt.figure(figsize=[20,5])
plt.plot(range(1,21),prec_list,color="red",label="prec")
plt.plot(range(1,21),recall_list,color='blue',label='recall')
plt.xticks(range(1,21))
plt.legend()
plt.show()
3)组合参数确定
通过学习曲线找到了最优的n_estimators和max_depth,对于模型而言,多个最优参数的组合不一定是最优的。给各参数在最优值附近设置一个区间,通过网格搜索找到最优参数组合。
from sklearn.model_selection import GridSearchCV
param_grid = {'n_estimators':[*range(165,173,1)]
              ,'max_depth':[*np.arange(5,9,1)]
              ,'criterion':('gini', 'entropy')
             }

brfc = BalancedRandomForestClassifier(
                                      n_jobs=-1
                                      ,random_state=90
                                    )
GS = GridSearchCV(brfc,param_grid,cv=10)#网格搜索
GS.fit(x_new_rfc,y)
print(GS.best_params_,GS.best_score_)
3.4、模型输出
import joblib
from sklearn.model_selection import train_test_split
# 划分数据
x_train,x_test,y_train,y_test = train_test_split(x_new_rfc,y,test_size=0.3,random_state=123)
brfc = BalancedRandomForestClassifier(n_estimators=166
                                     ,max_depth=8
                                     ,criterion='entropy'
                                     ,n_jobs=-1,
                                     ,random_state=90
                                     )
brfc.fit(x_train,y_train)
joblib.dump(brfc,'brfc_model.m')
result = brfc.predict(x_test)
score = brfc.score(x_test,y_test)
recall = recall_score(y_test, result)
print("accuracy: %f,recall:%f'" % (score,recall))


