开源框架ZedGraph的使用
.Net的绘图控件ZedGraph的使用
ZedGraph 是一个开源的.NET图表类库, 全部代码都是用C#开发的。它可以利用任意的数据集合创建2D的线性和柱形图表
我们一般不直接使用ZedGraphControl对象,而是使用它的面板对象来进行操作,这里我们将它的面板对象命名为myPane
//创建ZedGraph对象
 ZedGraph.ZedGraphControl zgc = new ZedGraph.ZedGraphControl();

//获得ZedGraph对象的面板对象
GraphPane myPane = zgc.GraphPane;
1、一些关于myPane对象的常用的属性及其作用
| 属性值 | 属性介绍 |
|---|---|
| XAxis | 图表的X轴 |
1、设置窗体的标题
myPane.Title.Text = “这是窗体的标题”
1、设置X轴等不使用10次幂表示数据,而是使用具体的数来表示
myPane.XAxis.Scale.IsUseTenPower = false;
2、在图形的显示界面中显示栅格
myPane.XAxis.MajorGrid.IsVisible = true;

    //设置X轴等不使用10次幂表示数据,而是使用具体的数来表示
    myPane.XAxis.Scale.Mag = 0;
    myPane.YAxis.Scale.Mag = 0;
    myPane.Y2Axis.Scale.Mag = 0;
3
     //去除两个Y轴之间标度的相互对应,使标度均匀分布
    myPane.YAxis.MajorTic.IsOpposite = false;
    myPane.Y2Axis.MajorTic.IsOpposite = false;
    myPane.YAxis.MinorTic.IsOpposite = false;
    myPane.Y2Axis.MinorTic.IsOpposite = false;
1、 基本操作
在初始化ZedGraphControl对象之后
ZedGraph.ZedGraphControl zedGraph = new ZedGraph.ZedGraphControl();
-
第一步,导入ZedGraph.dll文件,具体如何导入的参见:C#中如何导入本地dll文件
-
在Form1这个类中添加一个属性 private ZedGraph.ZedGraphControl zg1;我们在之后的窗体构建中需要使用到这个对象
-
在Form1.Designer.cs的 InitializeComponent()方法中添加如下代码,对我们的zg1属性进行初始化
            this.components = new System.ComponentModel.Container();
            this.zg1 = new ZedGraph.ZedGraphControl();
            this.SuspendLayout();
            //
            // zg1
            //
            this.zg1.Anchor = ((System.Windows.Forms.AnchorStyles)((((System.Windows.Forms.AnchorStyles.Top | System.Windows.Forms.AnchorStyles.Bottom)
            | System.Windows.Forms.AnchorStyles.Left)
            | System.Windows.Forms.AnchorStyles.Right)));
            this.zg1.EditButtons = System.Windows.Forms.MouseButtons.Left;
            this.zg1.Location = new System.Drawing.Point(12, 11);
            this.zg1.Name = "zg1";
            this.zg1.PanModifierKeys = ((System.Windows.Forms.Keys)((System.Windows.Forms.Keys.Shift | System.Windows.Forms.Keys.None)));
            this.zg1.ScrollGrace = 0D;
            this.zg1.ScrollMaxX = 0D;
            this.zg1.ScrollMaxY = 0D;
            this.zg1.ScrollMaxY2 = 0D;
            this.zg1.ScrollMinX = 0D;
            this.zg1.ScrollMinY = 0D;
            this.zg1.ScrollMinY2 = 0D;
            this.zg1.Size = new System.Drawing.Size(931, 524);
            this.zg1.TabIndex = 0;
			this.Controls.Add(this.zg1);

		this.ClientSize = new System.Drawing.Size(955, 547);
注意要设置this.ClientSize = new System.Drawing.Size(955, 547)的大小为(955,547),
原来的是(800,450),更改之后可以让生成的图形进行居中显示
- 此时就可以在Form1.cs中使用zg1了,创建一个
void CreateGraph(ZedGraphControl zgc)方法,入参是ZedGraphControl类型,此处的ZedGraphControl类是ZedGraph.dll中封装的一个类
 private void Form1_Load(object sender, EventArgs e)
        {
            CreateGraph(zg1);
        }
此时我们在Form1_Load方法中调用CreateGraph()方法,并将在Form1.Designer.cs中创建的属性zg1作为参数进行传递,接下来就是在CreateGraph()中写创建曲线的代码即可
- 首先创建一个面板对象(画的东西总得有个载体吧),作为二维图形,想要画图自然就是确定X与Y坐标,然后将每一个点使用曲线连接起来即可,这样就实现了曲线的绘制
GraphPane myPane = zgc.GraphPane;
创建GraphPane对象,这里的GraphPane类也是zedGraph中封装的一个类
            myPane.Title.Text = "曲线测试";
            myPane.XAxis.Title.Text = "X轴";
            myPane.YAxis.Title.Text = "Y轴";
这里设置了图形的标题,以及X轴与Y轴旁边显示的文本,运行程序,你会看到一个空的坐标轴以及你设置的3个文本信息,如下所示

这里的坐标轴的标度是系统默认的标度
- 曲线是由一个个点连接而成的,我们先创建一个曲线对象,再将点对象一个个放置到该曲线对象上,将这些点用曲线进行连接,就形成了我们需要的曲线效果了
- LineItem是ZedGraph自带的曲线对象
- PointPairList是ZedGraph自带的放置坐标点的容器对象,将坐标以(X,Y)的形式添加到容器中
            LineItem lineItem;

            Random random = new Random();


            PointPairList list = new PointPairList();

            for (int i = 0; i < 20; i++)
            {
                list.Add(i, random.NextDouble()  * 100);

            }

            lineItem = myPane.AddCurve("测试的曲线", list, Color.Red);

            zgc.AxisChange();
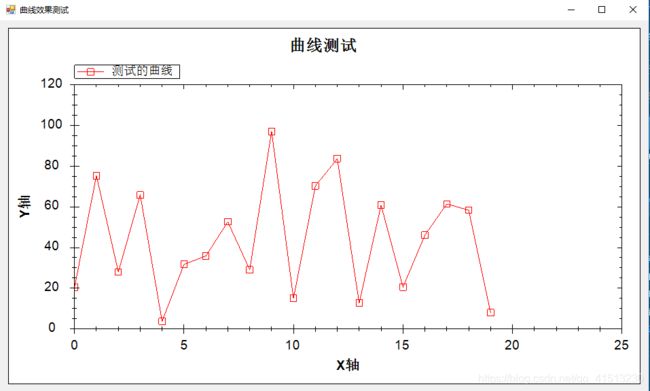
这里我们使用Random函数生成Y轴坐标,X坐标按照第几次循环来生成,这里我们创建的是最简单的一条曲线的情况。记住最后要加 zgc.AxisChange();这个方法的调用,曲线才能正常显示,显示的效果如下所示
