决策树——员工离职预测模型搭建(2)
上一章学了决策树——员工离职预测模型搭建,这一章将通过模型参数调优寻找出最佳决策树。
上一章模型搭建代码如下:
# 1.读取数据与简单预处理
import pandas as pd
df = pd.read_excel('员工离职预测模型.xlsx')
df = df.replace({'工资': {'低': 0, '中': 1, '高': 2}})

# 2.提取特征变量和目标变量
X = df.drop(columns='离职')
y = df['离职']

# 3.划分训练集和测试集
from sklearn.model_selection import train_test_split
X_train, X_test, y_train, y_test = train_test_split(X, y, test_size=0.2, random_state=123)

# 4.模型训练及搭建
from sklearn.tree import DecisionTreeClassifier
model = DecisionTreeClassifier(max_depth=3, random_state=123)
model.fit(X_train, y_train)
K折交叉验证
from sklearn.model_selection import cross_val_score
acc = cross_val_score(model, X, y, cv=5)
acc
from sklearn.model_selection import cross_val_score
acc = cross_val_score(model, X, y, scoring='roc_auc', cv=5)
accGridSearch网格搜索
1.单参数的参数调优
from sklearn.model_selection import GridSearchCV  # 网格搜索合适的超参数

# 指定参数k的范围
parameters = {'max_depth': [3, 5, 7, 9, 11]}
# 构建决策树分类器
model = DecisionTreeClassifier()  # 这里因为要进行参数调优,所以不需要传入固定的参数了

# 网格搜索
grid_search = GridSearchCV(model, parameters, scoring='roc_auc', cv=5)   # cv=5表示交叉验证5次,默认值为3;scoring='roc_auc'表示通过ROC曲线的AUC值来进行评分,默认通过准确度评分
grid_search.fit(X_train, y_train)

# 输出参数的最优值
grid_search.best_params_
#批量生成调参所需数据
import numpy as np
parameters = {'max_depth': np.arange(1, 10, 2)}2.参数调优的效果检验
根据max_depth=7来重新搭建模型,并进行检测
#查看新模型准确度
# 根据max_depth=7来重新搭建模型
model = DecisionTreeClassifier(max_depth=7)  # 这个max_depth参数是可以调节的,之后讲
model.fit(X_train, y_train)

# 查看整体预测准确度
y_pred = model.predict(X_test)
from sklearn.metrics import accuracy_score
score = accuracy_score(y_pred, y_test)
print(score)
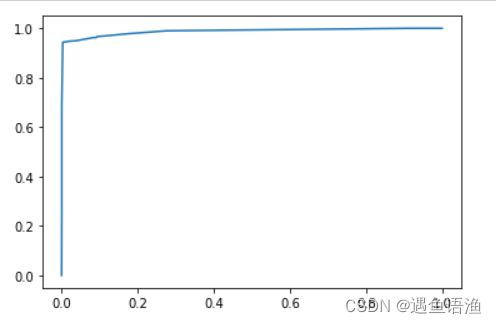
查看新模型的ROC曲线和AUC值
# 查看新的AUC值
# 预测不违约&违约概率
y_pred_proba = model.predict_proba(X_test)
y_pred_proba[:,1]  # 如果想单纯的查看违约概率,即查看y_pred_proba的第二列

# 绘制ROC曲线,计算AUC值
from sklearn.metrics import roc_curve
fpr, tpr, thres = roc_curve(y_test, y_pred_proba[:,1])

# 绘制ROC曲线
import matplotlib.pyplot as plt
plt.plot(fpr, tpr)
plt.show()
# 计算AUC值
from sklearn.metrics import roc_auc_score
score = roc_auc_score(y_test, y_pred_proba[:,1])
print(score)总结:原来获得的AUC值为0.9736,现在获得的AUC值为0.9877,的确提高了模型的预测水平
# 一一对应
features = X.columns
importances = model.feature_importances_

# 通过表格形式显示
importances_df = pd.DataFrame()  # 创建空二维表格,为之后准备
importances_df['特征名称'] = features
importances_df['特征重要性'] = importances

importances_df.sort_values('特征重要性', ascending=False)
决策树模型还有些别的超参数,如下所示:
下面是分类决策树模型DecisionTreeClassifier()模型常用的一些超参数及它们的解释:
- criterion:特征选择标准,取值为"entropy"信息熵和"gini"基尼系数,默认选择"gini"。
- splitter:取值为"best"和"random","best"在特征的所有划分点中找出最优的划分点,适合样本量不大的情况,"random"随机地在部分划分点中找局部最优的划分点,适合样本量非常大的情况,默认选择"best"。
- max_depth:决策树最大深度,取值为int或None,一般数据或特征比较少的时候可以不设置,如果数据或特征比较多时,可以设置最大深度进行限制。默认取‘None’。
- min_samples_split:子节点往下划分所需的最小样本数,默认取2,如果子节点中的样本数小于该值则停止分裂。
- min_samples_leaf:叶子节点的最少样本数,默认取1,如果小于该数值,该叶子节点会和兄弟节点一起被剪枝(即剔除该叶子节点和其兄弟节点,并停止分裂)。
- min_weight_fraction_leaf:叶子节点最小的样本权重和,默认取0,即不考虑权重问题,如果小于该数值,该叶子节点会和兄弟节点一起被剪枝(即剔除该叶子节点和其兄弟节点,并停止分裂)。如果较多样本有缺失值或者样本的分布类别偏差很大,则需考虑样本权重问题。
- max_features:在划分节点时所考虑的特征值数量的最大值,默认取None,可以传入int型或float型数据。如果是float型数据,表示百分数。
- max_leaf_nodes:最大叶子节点数,默认取None,可以传入int型数据。
- class_weight:指定类别权重,默认取None,可以取"balanced",代表样本量少的类别所对应的样本权重更高,也可以传入字典指定权重。该参数主要是为防止训练集某些类别的样本过多,导致训练的决策树过于偏向这些类别。除了此处指定class_weight,还可以使用过采样和欠采样的方法处理样本类别不平衡的问题,过采样和欠采样将在第十一章:数据预处理讲解。
- random_state:当数据量较大,或特征变量较多时,可能在某个节点划分时,会碰上两个特征变量的信息熵增益或者基尼系数减少量是一样的情况,那么此时决策树模型默认是随机从中选一个特征变量进行划分,这样可能会导致每次运行程序后生成的决策树不太一致。如果设定random_state参数(如设置为123)可以保证每次运行代码时,各个节点的分裂结果都是一致的,这在特征变量较多,树的深度较深的时候较为重要。
3.多参数调优
from sklearn.model_selection import GridSearchCV

# 指定决策树分类器中各个参数的范围
parameters = {'max_depth': [5, 7, 9, 11, 13], 'criterion':['gini', 'entropy'], 'min_samples_split':[5, 7, 9, 11, 13, 15]}
# 构建决策树分类器
model = DecisionTreeClassifier()  # 这里因为要进行参数调优,所以不需要传入固定的参数了

# 网格搜索
grid_search = GridSearchCV(model, parameters, scoring='roc_auc', cv=5)
grid_search.fit(X_train, y_train)

# 获得参数的最优值
grid_search.best_params_
# 根据多参数调优的结果来重新搭建模型
model = DecisionTreeClassifier(criterion='entropy', max_depth=11, min_samples_split=13)
model.fit(X_train, y_train)
# 查看整体预测准确度
y_pred = model.predict(X_test)
from sklearn.metrics import accuracy_score
score = accuracy_score(y_pred, y_test)
print(score)# 查看新的AUC值
# 预测不违约&违约概率
y_pred_proba = model.predict_proba(X_test)
y_pred_proba[:,1] # 如果想单纯的查看违约概率,即查看y_pred_proba的第二列
score = roc_auc_score(y_test, y_pred_proba[:,1])
print(score)总结:这里多参数调优后发现,模型效果的确有所优化
注意点1:多参数调优和分别单参数调优的区别
多参数调优和单参数分别调优是有区别的,比如有的读者为了省事,对上面的3个参数进行3次单独的单参数调优,然后将结果汇总,这样的做法其实是不严谨的。因为在进行单参数调优的时候,是默认其他参数取默认值的,那么该参数和其他参数都不取默认值的情况就没有考虑进来,也即忽略了多个参数对模型的组合影响。以上面的代码示例来说,使用多参数调优时,它是526=60种组合可能,而如果是进行3次单参数调优,则只是5+2+6=13种组合可能。 因此,如果只需要调节一个参数,那么可以使用单参数调优,如果需要调节多个参数,则推荐使用多参数调优。
注意点2:参数取值是给定范围的边界
另外一点需要需要注意的是,如果使用GridSearchCV()方法所得到的参数取值是给定范围的边界,那么有可能存在范围以外的取值使得模型效果更好,因此需要我们额外增加范围,继续调参。举例来说,倘若上述代码中获得的最佳max_depth值为设定的最大值13,那么实际真正合适的max_depth可能更大,此时便需要将搜索网格重新调整,如将max_depth的搜索范围变成[9, 11, 13, 15, 17],再重新参数调优。
