爬取气象局获取24小时温度+数据可视化
文章目录
-
- 踩点
- 获取所有城市的链接
- 爬取单个城市24小时气温
- 数据处理
- 数据可视化
- 总代码
踩点
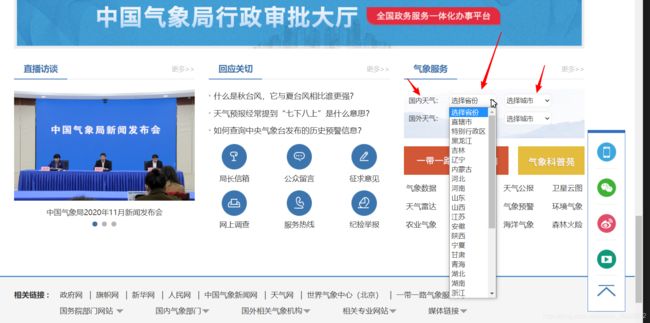
首先进入网站 http://www.cma.gov.cn/
一直往下滑,找到气象服务这里,随便点击一个城市
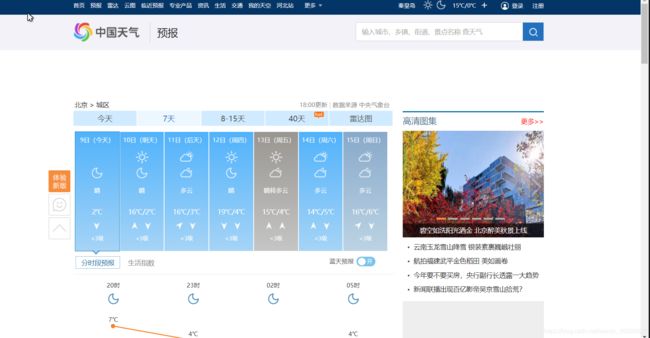
会发现它打开了一个新的标签页,进去看看
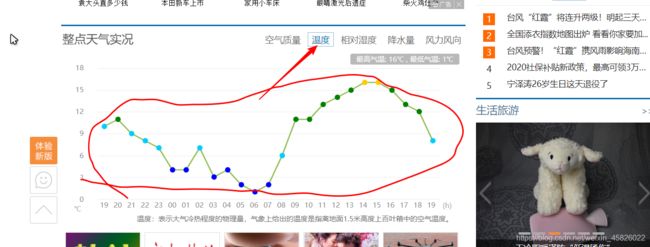
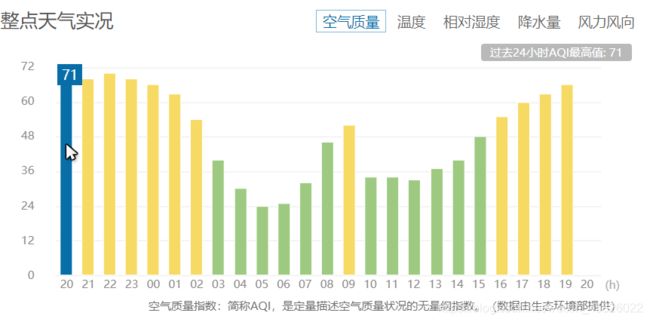
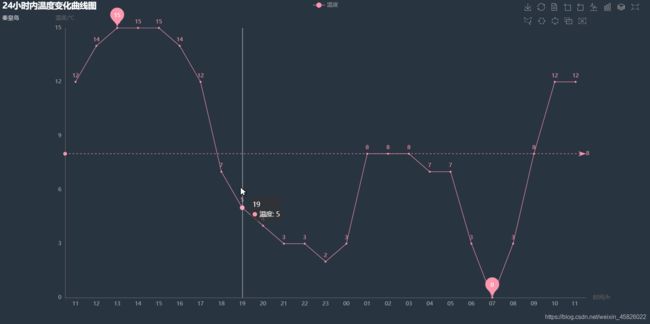
点击整点天气实况的温度项,我们可以看到24小时内的气温变化曲线,我们的目标就是根据输入的城市,抓取24小时内的气温数据,然后用可视化显示出来
获取所有城市的链接
在上面的踩点中我们已经发现,每次选择一个城市都将跳转到一个对应该城市的标签页
我们打开北京的标签,网址为 :http://www.weather.com.cn/html/weather/101010100.shtml
我们再打开上海的标签,网址为:http://www.weather.com.cn/html/weather/101020100.shtml
对比发现,只是有一串数字变了,我们先去网站看一下
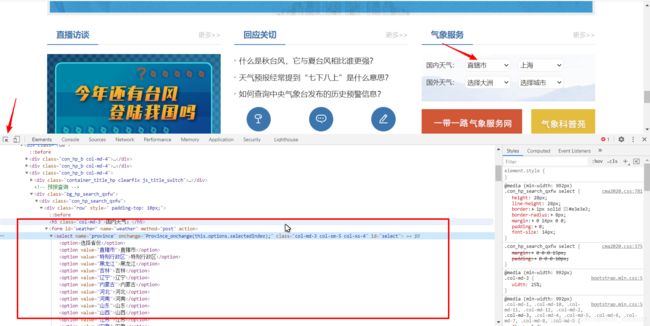
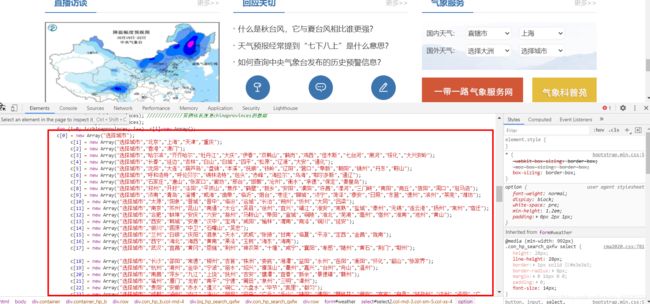
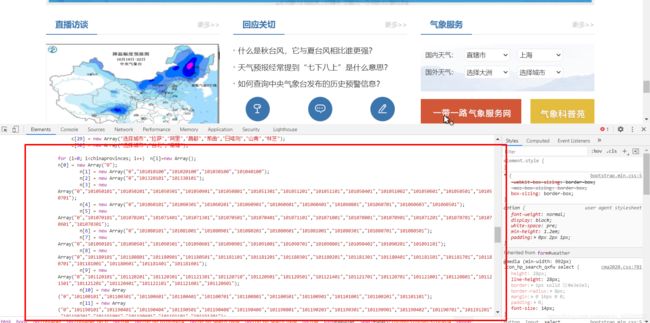
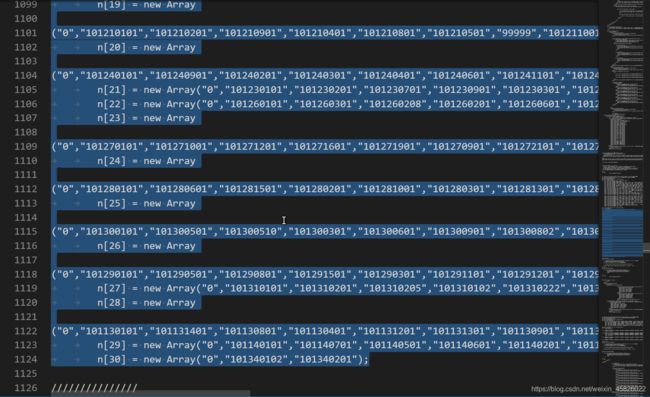
我们往下展开了几个标签,发现了一堆数据,大致看一下,发现每个数组
c[i]城市与下面的n[i]数字是一一对应的,那这个映射就是我们要找的东西,而且这玩意是一直不变的,那我们直接抓取这个url
import requests
import re


headers = {
    'User-Agent': 'Mozilla/5.0 (Windows NT 10.0; Win64; x64) AppleWebKit/537.36 (KHTML, like Gecko) Chrome/86.0.4240.183 Safari/537.36',
}

r = requests.get('http://www.cma.gov.cn/',headers=headers)
r.encoding = r.apparent_encoding

f = open('./html.txt','wb')
f.write(r.text.encode('utf8'))
f.close()
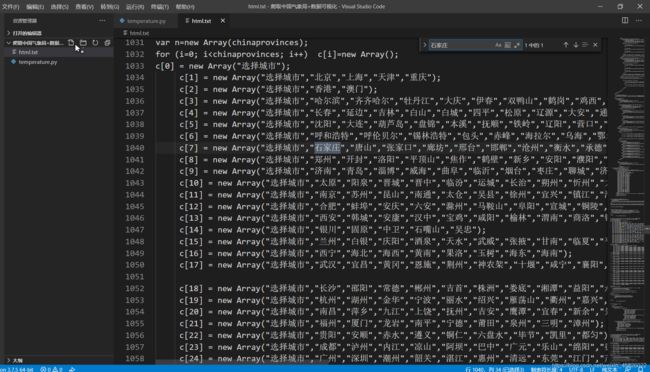
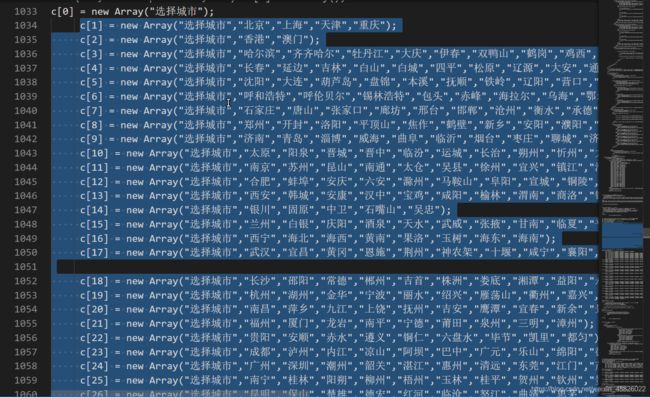
我们在txt中定位到刚刚看到的一堆数据这里,发现没有缺什么东西
那就直接上正则提取,并进行一些处理
import requests
import re


headers = {
    'User-Agent': 'Mozilla/5.0 (Windows NT 10.0; Win64; x64) AppleWebKit/537.36 (KHTML, like Gecko) Chrome/86.0.4240.183 Safari/537.36',
}

r = requests.get('http://www.cma.gov.cn/',headers=headers)
r.encoding = r.apparent_encoding


city = re.findall('c\[\d{,2}\] = new Array\("选择城市",(.*?)\)',r.text)
city = re.findall('"([\u4e00-\u9fa5]*?)"',str(city))

sign = re.findall('n\[\d{,2}\] = new Array.*?\("0",(.*?)\)',r.text,re.S)
sign = re.findall('"(\d*?)"',str(sign))

print(len(city), city)
print(len(sign), sign)
运行一下,看看对应有没有找到
出问题了!我们的映射应该是一对一的,可是城市比数字多了一个,我们需要把错误的城市清洗掉,否则无法将这两个列表转为字典。
这里没有想到好的方法,我采用了最暴力的笨方法。
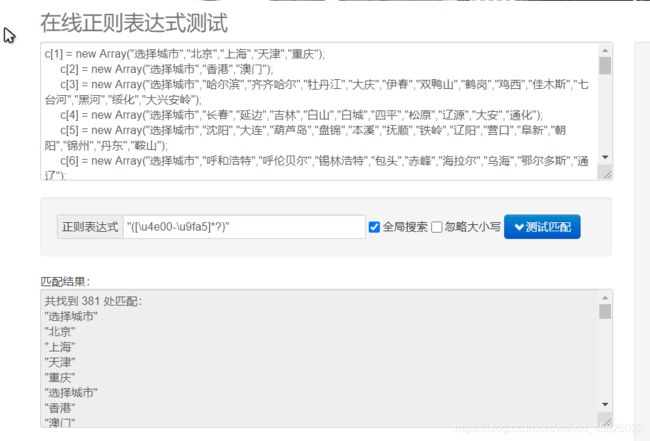
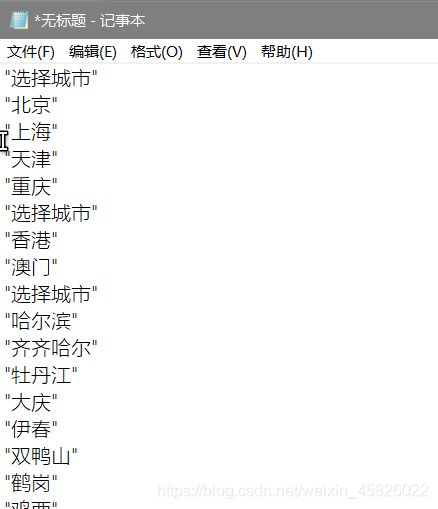
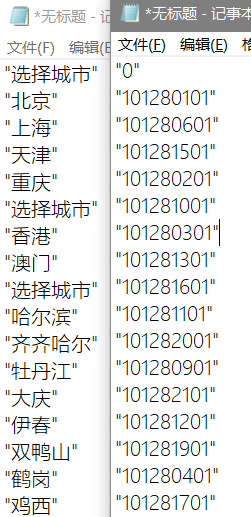
没错,我将文本里的所有城市数据复制下来,来到 在线正则网站,提取里面的汉字。
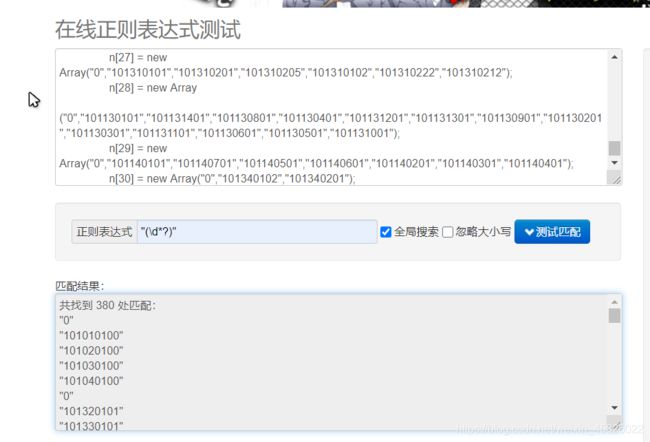
同样的,我们再把数字复制下来,再次进行提取。
将他们两个对齐,以
"选择城市"——>"0"这个关系,来进行查找,理论上"选择城市"和"0"应该是在同一行的,如果不在,那就说明上面有一组数据出了问题!
很快,我们便定位到了错误的地方,然后前往气象局网页,去看看这个佛山怎么回事。
选择佛山后,跳出来一个新的标签页,然而这个标签页什么都没有,那看来不是我们代码的问题,而是根本没有佛山的网页,那么我们直接用
remove把佛山给删去。
然后将其他城市与数字转为字典。
import requests
import re


headers = {
    'User-Agent': 'Mozilla/5.0 (Windows NT 10.0; Win64; x64) AppleWebKit/537.36 (KHTML, like Gecko) Chrome/86.0.4240.183 Safari/537.36',
}

r = requests.get('http://www.cma.gov.cn/',headers=headers)
r.encoding = r.apparent_encoding


city = re.findall('c\[\d{,2}\] = new Array\("选择城市",(.*?)\)',r.text)
city = re.findall('"([\u4e00-\u9fa5]*?)"',str(city))
# 不存在佛山的网页
city.remove('佛山')

sign = re.findall('n\[\d{,2}\] = new Array.*?\("0",(.*?)\)',r.text,re.S)
sign = re.findall('"(\d*?)"',str(sign))

city_sign = dict(zip(city,sign))
print(city_sign)
运行一下
成功获取到映射关系,那么我们可以便根据这个映射,找出每个城市对应的url
最后,我们将整个获取映射的过程封装成一个函数,以便后续调用
import requests
import re


headers = {
    'User-Agent': 'Mozilla/5.0 (Windows NT 10.0; Win64; x64) AppleWebKit/537.36 (KHTML, like Gecko) Chrome/86.0.4240.183 Safari/537.36',
}


def getCitySign() -> dict:
    r = requests.get('http://www.cma.gov.cn/',headers=headers)
    if r.status_code != 200:
        print('访问气象局网站错误!')
        return None
    r.encoding = r.apparent_encoding

    city = re.findall('c\[\d{,2}\] = new Array\("选择城市",(.*?)\)',r.text)
    city = re.findall('"([\u4e00-\u9fa5]*?)"',str(city))
    # 不存在佛山的网页
    city.remove('佛山')

    sign = re.findall('n\[\d{,2}\] = new Array.*?\("0",(.*?)\)',r.text,re.S)
    sign = re.findall('"(\d*?)"',str(sign))

    city_sign = dict(zip(city,sign))
    return city_sign
- Tips:睡了一觉,想到了一个不用自己搜错误信息的好方法——二分查找
- 用二分查找定位到错误的地方,然后删除掉该信息
- 代码如下:
import requests
import re

headers = {
    'User-Agent': 'Mozilla/5.0 (Windows NT 10.0; Win64; x64) AppleWebKit/537.36 (KHTML, like Gecko) Chrome/86.0.4240.183 Safari/537.36',
}

# 检测当前键值是否匹配
def checkInfo(city:str,sign:str)->bool:
    url = 'http://www.weather.com.cn/html/weather/%s.shtml'%sign
    res = requests.get(url,headers=headers)
    res.encoding = res.apparent_encoding
    result = re.search('shtml" target="_blank">(.*?)<',res.text).group(1)
    if city == result:
        return True
    return False

def getCitySign() -> dict:
    r = requests.get('http://www.cma.gov.cn/',headers=headers)
    if r.status_code != 200:
        print('访问气象局网站错误!')
        return None
    r.encoding = r.apparent_encoding

    city = re.findall('c\[\d{,2}\] = new Array\("选择城市",(.*?)\)',r.text)
    city = re.findall('"([\u4e00-\u9fa5]*?)"',str(city))
    # 不存在佛山的网页
    # city.remove('佛山')

    sign = re.findall('n\[\d{,2}\] = new Array.*?\("0",(.*?)\)',r.text,re.S)
    sign = re.findall('"(\d*?)"',str(sign))

    # 二分查找
    l,r=0,len(sign)-1
    mid = (l+r)//2
    while l!=r:
        if checkInfo(city[mid], sign[mid]):
            l = mid+1
        else:
            r = mid
        mid = (l+r)//2
    city.pop(l)

    city_sign = dict(zip(city,sign))
    return city_sign

print(getCitySign())
- 不过这里用处不大,后面还是以直接删除 佛山 的代码为例。
爬取单个城市24小时气温
以北京的网页为例,首先进入北京的气象网页,将表切换到温度曲线,然后检查元素,定位到该位置
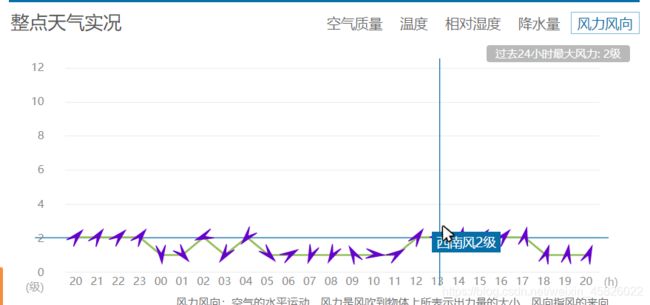
仔细看了看,并没有发现温度的数据所在位置,直接搜温度数字的话,肯定不现实,太多了,我们注意到有个风力风向表,过去看看
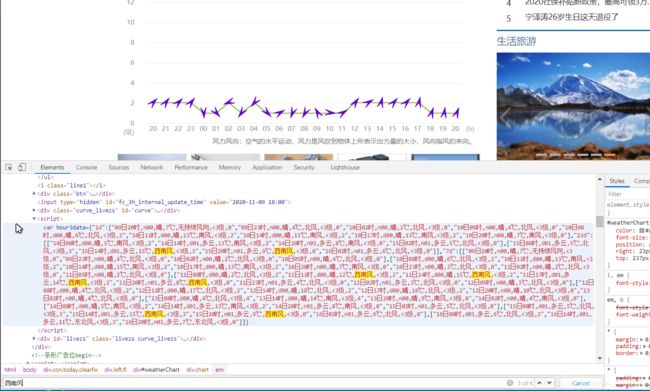
这里发现了一些汉字,那以这些汉字为标识,直接在整个网页代码里搜一下
很快便定位到了一堆数据里面,发现这个数据非常可疑,仔细观察观察。发现并不是。。。那就继续往下搜
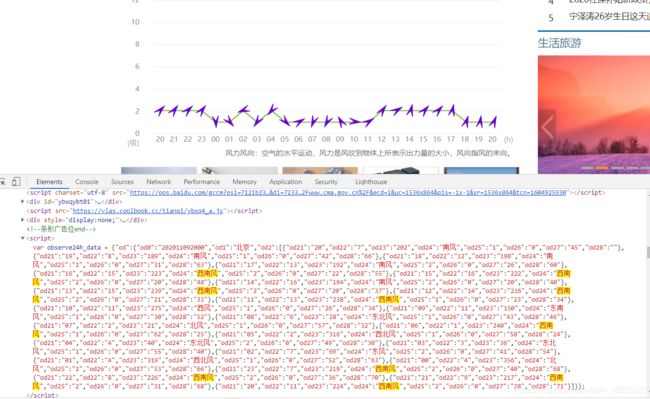
这一次获取到的应该就是了。我们仔细分析分析。先把数据拷贝到文本里面(方便搜索)
综合考虑,决定以空气质量的值开始搜(值大,几乎没有重复值,较大几率唯一)
我们直接对着这个数据搜。
果然,只有一个搜索结果,发现这是倒着的,那我们就以这个字典,来探索一下各个参数是什么
先将这条复制下来,数据是倒着的,所以这个最后一条其实是网页中的第一个数据,我们根据空气质量,温度,相对湿度,降水量,风力风向这五个表的第一个数据,来推一下上面 odxx 对应的含义。
不难得出:
至此我们已经分析完,写出代码,用正则提取 小时、温度、相对湿度、空气质量即可
import requests
import re


headers = {
    'User-Agent': 'Mozilla/5.0 (Windows NT 10.0; Win64; x64) AppleWebKit/537.36 (KHTML, like Gecko) Chrome/86.0.4240.183 Safari/537.36',
}

response = requests.get('http://www.weather.com.cn/html/weather/101010100.shtml',headers=headers)
response.encoding = response.apparent_encoding
# 时间,需要反转一下,因为最后一条数据对应第一个
x_time = re.findall('"od21":"(.*?)"',response.text)
x_time.reverse()
# 温度
temp = re.findall('"od22":"(.*?)"',response.text)
temp.reverse()
# 湿度
humidity = re.findall('"od27":"(.*?)"',response.text)
humidity.reverse()
# 空气质量
air = re.findall('"od28":"(.*?)"',response.text)
air.reverse()

print(len(x_time),x_time)
print(len(temp),temp)
print(len(humidity),humidity)
print(len(air),air)
运行结果:
成功!
将上面的步骤写成一个函数,方便调用
def getCityInfo(url:str) ->(list,list,list,list):
    response = requests.get(url, headers=headers)
    response.encoding = response.apparent_encoding
    # 时间,需要反转一下,因为最后一条数据对应第一个
    _time = re.findall('"od21":"(.*?)"',response.text)
    _time.reverse()
    # 温度
    _temp = re.findall('"od22":"(.*?)"',response.text)
    _temp.reverse()
    # 湿度
    _humidity = re.findall('"od27":"(.*?)"',response.text)
    _humidity.reverse()
    # 空气质量
    _air = re.findall('"od28":"(.*?)"',response.text)
    _air.reverse()

    return _time,_temp,_humidity,_air
数据处理
在进行数据可视化之前,我们需要对 时间 进行一下处理,因为我们发现时间有重复值(24小时,当天与后一天的时刻会有一个重复值),而有重复值是不能作为x轴的。
很简单,我们将最后一个时间加一个空格即可。
- 将上面的
getCityInfo函数改为:
def getCityInfo(url:str) ->(list,list,list,list):
    response = requests.get(url, headers=headers)
    response.encoding = response.apparent_encoding
    # 时间,需要反转一下,因为最后一条数据对应第一个
    _time = re.findall('"od21":"(.*?)"',response.text)
    _time.reverse()
    _time[24] = _time[24] + ' '
    # 温度
    _temp = re.findall('"od22":"(.*?)"',response.text)
    _temp.reverse()
    # 湿度
    _humidity = re.findall('"od27":"(.*?)"',response.text)
    _humidity.reverse()
    # 空气质量
    _air = re.findall('"od28":"(.*?)"',response.text)
    _air.reverse()

    return _time,_temp,_humidity,_air
数据可视化
这里使用 pyecharts 进行数据可视化
- 首先获取城市信息:
city_list = getCitySign()

while 1:
    query_city = input("输入查询的城市:")
    try:
        city_sign = city_list[query_city]
    except KeyError as e:
        print("无此城市信息,请重新输入!")
    else:
        break

url = 'http://www.weather.com.cn/html/weather/%s.shtml'%city_sign

time_ ,temp_ ,hum_ ,air_ = getCityInfo(url)
-
然后根据数据,绘制图表:
-
绘制温度曲线:
def temp_line()->Line:
    c = (
        Line(init_opts=opts.InitOpts(theme=ThemeType.CHALK,width="1400px", height="700px"))
        .add_xaxis(time_)
        .add_yaxis(
            series_name="温度",
            y_axis=temp_,
            markpoint_opts=opts.MarkPointOpts(
                data=[
                    opts.MarkPointItem(type_="max", name="最大值"),
                    opts.MarkPointItem(type_="min", name="最小值"),
                ],
            ),
            markline_opts=opts.MarkLineOpts(
                data=[opts.MarkLineItem(type_="average", name="平均值")],
            ),
        )
        .set_global_opts(
            title_opts=opts.TitleOpts(title="24小时内温度变化曲线图", subtitle=query_city),
            tooltip_opts=opts.TooltipOpts(trigger="axis"),
            toolbox_opts=opts.ToolboxOpts(is_show=True),
            xaxis_opts=opts.AxisOpts(name="时间/h"),
            yaxis_opts=opts.AxisOpts(name="温度/℃"),
        )
    )
    return c
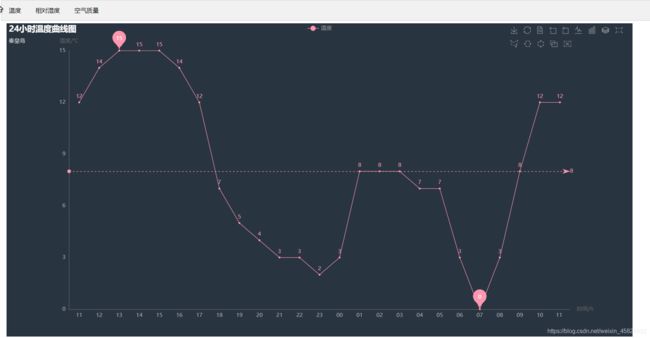
- 调用一下,看看结果:
temp_line().render('./temp.html')
- 效果还不错
- 绘制相对湿度曲线
def hum_line() -> Line:
    c = (
        Line(init_opts=opts.InitOpts(theme=ThemeType.CHALK,width="1400px", height="700px"))
        .add_xaxis(time_)
        .add_yaxis(
            series_name="相对湿度",
            y_axis=hum_,
        )
        .set_global_opts(
            title_opts=opts.TitleOpts(title="24小时相对湿度曲线图",subtitle=query_city),
            tooltip_opts=opts.TooltipOpts(trigger="axis"),
            toolbox_opts=opts.ToolboxOpts(is_show=True),
            xaxis_opts=opts.AxisOpts(name="时间/h"),
            yaxis_opts=opts.AxisOpts(name="相对湿度/%")
        )
    )
    return c
- 绘制空气质量柱形图
def air_bar() -> Bar:
    c = (
        Bar(init_opts=opts.InitOpts(theme=ThemeType.CHALK,width="1400px", height="700px"))
        .add_xaxis(time_)
        .add_yaxis(
            series_name="空气质量",
            yaxis_data=air_
        )
        .set_global_opts(
            title_opts=opts.TitleOpts(title="24小时空气质量曲线图",subtitle=query_city),
            tooltip_opts=opts.TooltipOpts(trigger="axis"),
            toolbox_opts=opts.ToolboxOpts(is_show=True),
            xaxis_opts=opts.AxisOpts(name="时间/h"),
            yaxis_opts=opts.AxisOpts(name="空气质量")
        )
    )
    return c
- 将三个图整合起来
tab = Tab()
tab.add(temp_line(),"温度")
tab.add(hum_line(),"相对湿度")
tab.add(air_bar(),"空气质量")
tab.render(query_city+"气温变化图.html")
- 最终效果:
总代码
- 为了方便,我们添加一个绘完图后自动打开的代码
import os
......
os.system(os.getcwd()+'\\'+query_city+"气温变化图.html")
- 总代码
import requests
import re
import pyecharts.options as opts
from pyecharts.charts import Line,Bar,Tab
from pyecharts.globals import ThemeType
import os

headers = {
    'User-Agent': 'Mozilla/5.0 (Windows NT 10.0; Win64; x64) AppleWebKit/537.36 (KHTML, like Gecko) Chrome/86.0.4240.183 Safari/537.36',
}


def getCitySign() -> dict:
    r = requests.get('http://www.cma.gov.cn/',headers=headers)
    if r.status_code != 200:
        print('访问气象局网站错误!')
        return None
    r.encoding = r.apparent_encoding

    city = re.findall('c\[\d{,2}\] = new Array\("选择城市",(.*?)\)',r.text)
    city = re.findall('"([\u4e00-\u9fa5]*?)"',str(city))
    # 不存在佛山的网页
    city.remove('佛山')

    sign = re.findall('n\[\d{,2}\] = new Array.*?\("0",(.*?)\)',r.text,re.S)
    sign = re.findall('"(\d*?)"',str(sign))

    city_sign = dict(zip(city,sign))
    return city_sign


def getCityInfo(url:str) ->(list,list,list,list):
    response = requests.get(url, headers=headers)
    response.encoding = response.apparent_encoding
    # 时间,需要反转一下,因为最后一条数据对应第一个
    _time = re.findall('"od21":"(.*?)"',response.text)
    _time.reverse()
    _time[24] = _time[24] + ' '
    # 温度
    _temp = re.findall('"od22":"(.*?)"',response.text)
    _temp.reverse()
    # 湿度
    _humidity = re.findall('"od27":"(.*?)"',response.text)
    _humidity.reverse()
    # 空气质量
    _air = re.findall('"od28":"(.*?)"',response.text)
    _air.reverse()

    return _time,_temp,_humidity,_air


city_list = getCitySign()

while 1:
    query_city = input("输入查询的城市:")
    try:
        city_sign = city_list[query_city]
    except KeyError as e:
        print("无此城市信息,请重新输入!")
    else:
        break

url = 'http://www.weather.com.cn/html/weather/%s.shtml'%city_sign

time_ ,temp_ ,hum_ ,air_ = getCityInfo(url)

def temp_line() -> Line:
    c = (
        Line(init_opts=opts.InitOpts(theme=ThemeType.CHALK,width="1400px", height="700px"))
        .add_xaxis(time_)
        .add_yaxis(
            series_name="温度",
            y_axis=temp_,
            markpoint_opts=opts.MarkPointOpts(
                data=[
                    opts.MarkPointItem(type_="max", name="最大值"),
                    opts.MarkPointItem(type_="min", name="最小值"),
                ],
            ),
            markline_opts=opts.MarkLineOpts(
                data=[opts.MarkLineItem(type_="average", name="平均值")],
            ),
        )
        .set_global_opts(
            title_opts=opts.TitleOpts(title="24小时温度曲线图", subtitle=query_city),
            tooltip_opts=opts.TooltipOpts(trigger="axis"),
            toolbox_opts=opts.ToolboxOpts(is_show=True),
            xaxis_opts=opts.AxisOpts(name="时间/h"),
            yaxis_opts=opts.AxisOpts(name="温度/℃"),
        )
    )
    return c

def hum_line() -> Line:
    c = (
        Line(init_opts=opts.InitOpts(theme=ThemeType.CHALK,width="1400px", height="700px"))
        .add_xaxis(time_)
        .add_yaxis(
            series_name="相对湿度",
            y_axis=hum_,
        )
        .set_global_opts(
            title_opts=opts.TitleOpts(title="24小时相对湿度曲线图",subtitle=query_city),
            tooltip_opts=opts.TooltipOpts(trigger="axis"),
            toolbox_opts=opts.ToolboxOpts(is_show=True),
            xaxis_opts=opts.AxisOpts(name="时间/h"),
            yaxis_opts=opts.AxisOpts(name="相对湿度/%")
        )
    )
    return c

def air_bar() -> Bar:
    c = (
        Bar(init_opts=opts.InitOpts(theme=ThemeType.CHALK,width="1400px", height="700px"))
        .add_xaxis(time_)
        .add_yaxis(
            series_name="空气质量",
            yaxis_data=air_
        )
        .set_global_opts(
            title_opts=opts.TitleOpts(title="24小时空气质量曲线图",subtitle=query_city),
            tooltip_opts=opts.TooltipOpts(trigger="axis"),
            toolbox_opts=opts.ToolboxOpts(is_show=True),
            xaxis_opts=opts.AxisOpts(name="时间/h"),
            yaxis_opts=opts.AxisOpts(name="空气质量")
        )
    )
    return c


tab = Tab()
tab.add(temp_line(),"温度")
tab.add(hum_line(),"相对湿度")
tab.add(air_bar(),"空气质量")
tab.render(query_city+"气温变化图.html")

os.system(os.getcwd()+'\\'+query_city+"气温变化图.html")
