多时点DID实证流程笔记(Aggregate Effects from Public Works: Evidence from India)
- 文章、数据及stata代码来源:
链接:https://pan.baidu.com/s/1nBvlYGXkV7ednEx93ge1ZQ
提取码:vs5q
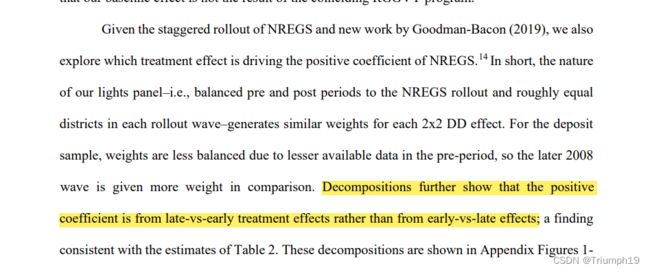
- 本文进行的平行趋势检验、异质性检验均与大部分中文文献的处理方式不同,以及Bacon分解的方法对交叠did的潜在偏误进行诊断的做法也是比较新颖的。
- 另外,我也是才接触多时点did模型,大家可以对这篇笔记继续补充,如果能将补充或发现错误的地方告诉我,那就更好了!!!!
前言
- 文章选题大致背景:评估2006-2008年分三批实施的NREGS政策效应。
- 在看这篇文章之前,最好先下载:王锋,葛星.低碳转型冲击就业吗——来自低碳城市试点的经验证据[J].中国工业经济,2022,(05):81-99.这篇工业经济的文章运用的也是多时点DID模型,但是在模型的处理上与这篇英文文章存在较大差异。
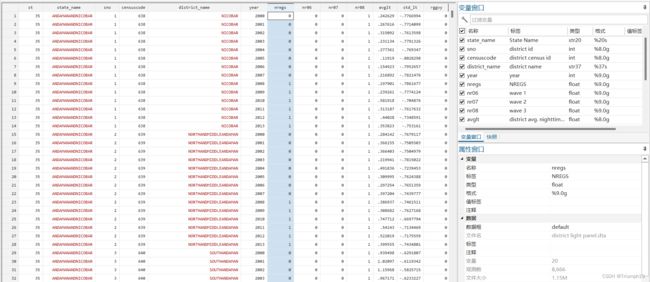
- 数据结构:这里的政策变量是nregs,如果某个街区受到受到了政策影响,则取值为1,否则取值为0;nr06表示街区是否受到06年政策影响的二值虚拟变量,nr07表示是否受到07年政策影响的二值虚拟变量,nr08表示是否受到08年政策影响的二值虚拟变量。
对三组处理组的描述性统计分析
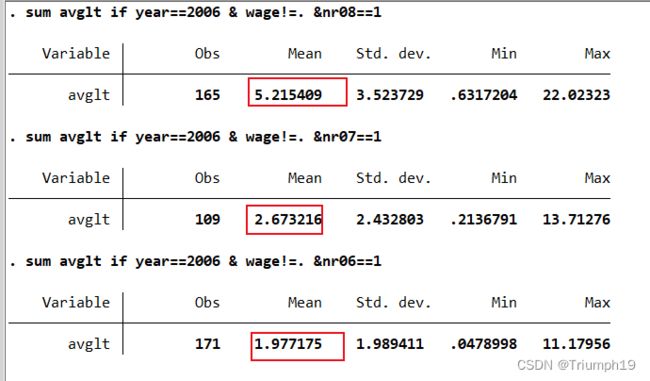
- On average, wave one and two districts are poorer than wave three districts, meaning earlier districts are poorer.
表格呈现
- 由附录表1知,
/*** APPENDIX ***
*********************
*** Summary Stats ***
*********************
*full sample
sum avglt
sum avglt if year<2006
sum avglt if year>=2006
sum nr06 nr07 nr08 if year==2006

*restricted sample
sum avglt if wage!=.
sum avglt if year<2006 & wage!=.
sum avglt if year>=2006 & wage!=.
sum nr06 nr07 nr08 if year==2006 & wage!=.

sum rggvy wage outputwage state_frac if year==2006
sum wage outputwage state_frac if nr06==1 & year==2006
sum wage outputwage state_frac if nr07==1 & year==2006
sum wage outputwage state_frac if nr08==1 & year==2006
- 上面的代码,笔者不知道怎么能够得出wave3的平均的经济发展水平高于wave1和wave2的。
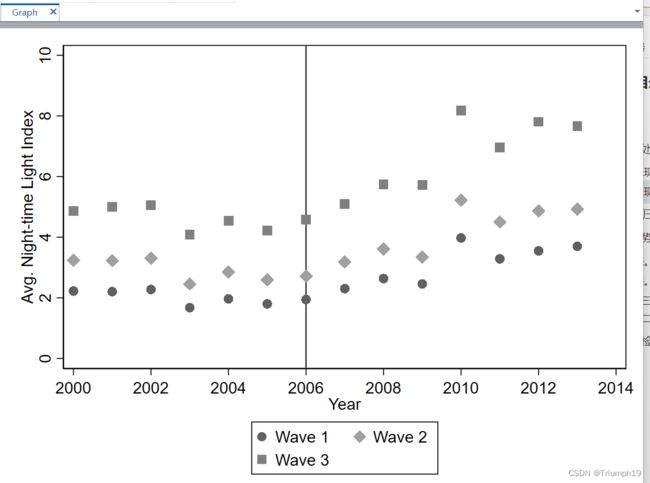
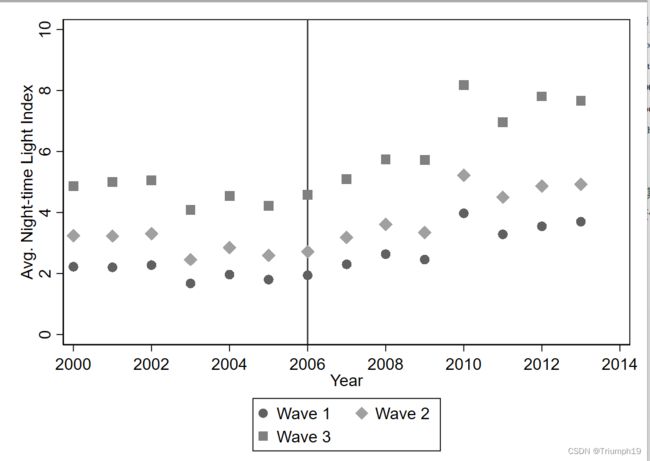
- 笔者认为应该用下面代码来得出此结论,在政策开始实施时(2006年),平均来看,wave3确实比wave1和wave2的经济发展水平(这里用街区夜间平均灯光数来表示)。
图表呈现
*** Fig. 1a: Mean by Wave ***
*****************************
set scheme s1mono //设置图片的主题

bysort year: egen avglt_06 = mean(avglt) if year>=2000 & nr06==1
bysort year: egen avglt_07 = mean(avglt) if year>=2000 & nr07==1
bysort year: egen avglt_08 = mean(avglt) if year>=2000 & nr08==1

label var avglt_06 "Wave 1"
label var avglt_07 "Wave 2"
label var avglt_08 "Wave 3"

twoway (scatter avglt_06 year) (scatter avglt_07 year) (scatter avglt_08 year), xtitle(Year) ytitle(Avg. Night-time Light Index) ylabel(0(2)10) xlabel(2000(2)2014) xline(2006)
- 从上图可以清晰的看到在样本期间,wave3每一年的街区平均灯光数都高于wave1和wave2,证实了前面的表格得出的结论。
基准回归模型
- 上述多时点DID模型与一般文章中的模型不同之处体现在如下地方:
- 1.在固定效应的控制上:一般文章控制的固定效应都是个体固定效应和时间固定效应,即双向固定效应,但是这里每个模型控制的个体固定效应(街区(sno)层面)和州层面(st)*year的双向交互固定效应;关于双向交互固定效应,参考文章:
【香樟推文2497】交叠DID偏误的原因、诊断和解决?你感兴趣的都在这 - 2.在控制变量的处理上:一般文章都是将控制变量本身作为控制变量,这里选择将这些变量与年度/季度变量的交互项作为控制变量。
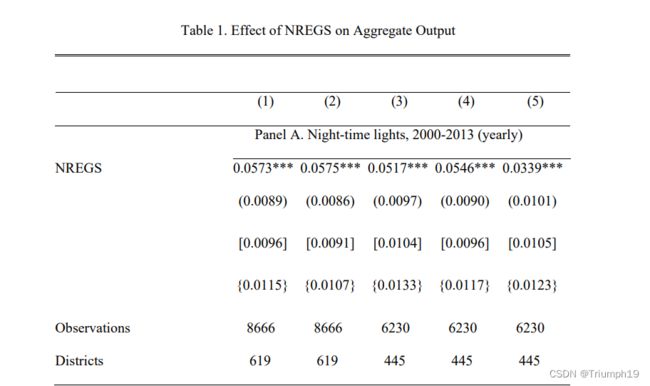
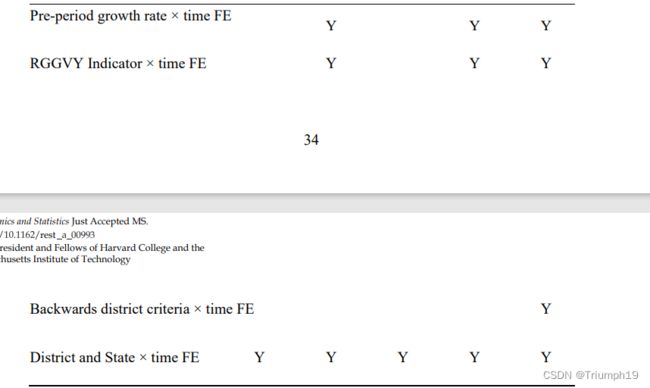
- 具体变化如Table1所示:
local pre "i.year#c.wage i.year#c.outputwage i.year#c.state_frac"
***********************************************
*** Table 1, Panel A. Base Analysis: Lights ***
***********************************************

*col. 1
reghdfe std_lt nregs , absorb(sno year#st) cluster(sno)
local b1 = _b[nregs]

*col. 2
reghdfe std_lt nregs i.year#c.dlt00_05 i.year#i.rggvy , absorb(sno year#st) cluster(sno)
local b2 = _b[nregs]

*col. 3
reghdfe std_lt nregs if wage!=., absorb(sno year#st) cluster(sno)
local b3 = _b[nregs]

*col. 4
reghdfe std_lt nregs i.year#c.dlt00_05 i.year#i.rggvy if  wage!=., absorb(sno year#st) cluster(sno)
local b4 = _b[nregs]

*col. 5
reghdfe std_lt nregs i.year#c.dlt00_05 i.year#i.rggvy `pre', absorb(sno year#st) cluster(sno)
local b5 = _b[nregs]
关于代码中#的含义,参考:https://blog.csdn.net/arlionn/article/details/80818984
平行趋势检验1
观察法。
- 首先查看了受到不同时间影响的街区的yit在样本期间的平均变化趋势,结果表明,在06年之前,三组不同样本的变化趋势没有显著变化,从直观上看是满足平行趋势假设的。
local pre "i.year#c.wage i.year#c.outputwage i.year#c.state_frac"


*****************************
*** Fig. 1a: Mean by Wave ***
*****************************
set scheme s1mono

bysort year: egen avglt_06 = mean(avglt) if year>=2000 & nr06==1
bysort year: egen avglt_07 = mean(avglt) if year>=2000 & nr07==1
bysort year: egen avglt_08 = mean(avglt) if year>=2000 & nr08==1

label var avglt_06 "Wave 1"
label var avglt_07 "Wave 2"
label var avglt_08 "Wave 3"

twoway (scatter avglt_06 year) (scatter avglt_07 year) (scatter avglt_08 year), xtitle(Year) ytitle(Avg. Night-time Light Index) ylabel(0(2)10) xlabel(2000(2)2014) xline(2006)
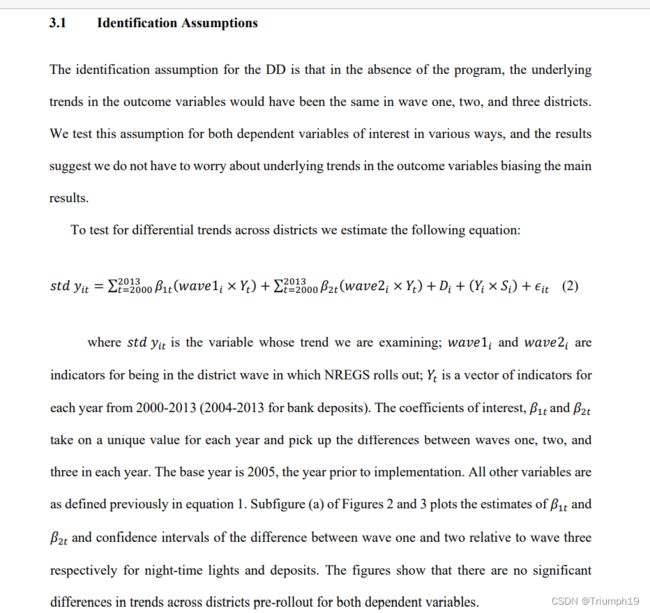
系数法。
将第三批试点政策确定的街区作为对照组
*** Fig. 2a: Event Figure, Early Waves ***
******************************************
gen wave1=nr06
gen wave2=nr07
gen wave3=nr08
tab year, gen(yr)

*store wave 1 results
forvalues i=1/14{
gen w`i'=0 if wave1~=.
	replace w`i'=1 if wave1==1 & yr`i'==1

gen x`i'=0 if wave2~=.
	replace x`i'=1 if wave2==1 & yr`i'==1
}

*omit 2006
replace w6=0 if wave1~=.
replace x6=0 if wave2~=.


*estimation
reghdfe std_lt w1 w2 w3 w4 w5 w6 w7 w8 w9 w10 w11 w12 w13 w14 x1 x2 x3 x4 x5 x6 x7 x8 x9 x10 x11 x12 x13 x14, absorb(sno year#st) cluster(sno)

*store
estadd ysumm
eststo lights_w1

drop w1-w14 x1-x14


*store wave 2 results
forvalues i=1/14{
gen w`i'=0 if wave2~=.
	replace w`i'=1 if wave2==1 & yr`i'==1

gen x`i'=0 if wave1~=.
	replace x`i'=1 if wave1==1 & yr`i'==1
}

*omit 2006
replace w6=0 if wave2~=.
replace x6=0 if wave1~=.


*estimation
reghdfe std_lt  w1 w2 w3 w4 w5 w6 w7 w8 w9 w10 w11 w12 w13 w14 x1 x2 x3 x4 x5 x6 x7 x8 x9 x10 x11 x12 x13 x14, absorb(sno year#st) cluster(sno)

*store
estadd ysumm
eststo lights_w2


*label years
forvalue i=1/14{
local j = 1999+`i'
label var w`i' "`j'"
}


set scheme s1mono //设置绘图模板https://blog.csdn.net/weixin_39611308/article/details/111373344
coefplot (lights_w1, label("Wave 1")) (lights_w2, label("Wave 2")), keep(w1 w2 w3 w4 w5 w6 w7 w8 w9 w10 w11 w12 w13 w14) vertical ytitle(Coefficient on Wave*Year)   ylabel(-.5(.1).5) xlabel(,labsize(small)) yline(0) levels(95) ciopts(lpattern(dash)) omitted baselevels ///
     groups(w1 w2 w3 w4 w5 w6 = `""{bf:Pre-Rollout}" "(No Districts)""'        ///
            w7 w8 w9 = `""{bf:Rollout}" "(Early Districts)""'                      ///
            w10 w11 w12 w13 w14    = `""{bf:Post-Rollout}" "(All Districts)""')
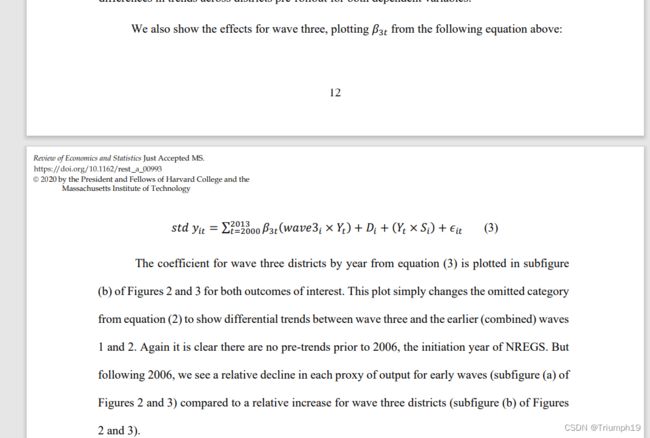
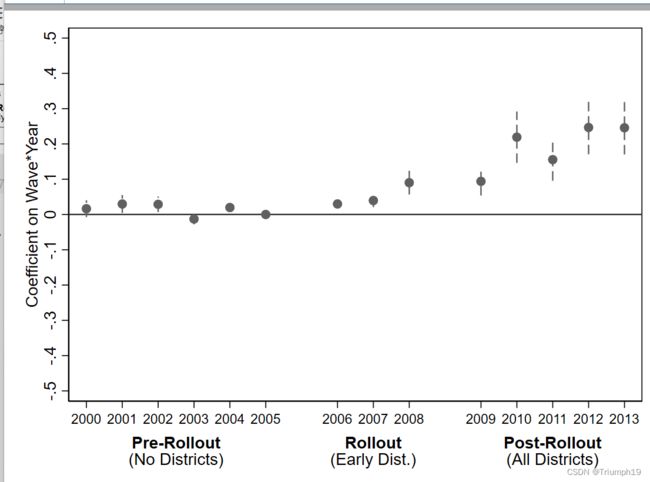
将一二批街区作为对照组
drop w1-w14 x1-x14

forvalues i=1/14{
gen w`i'=0 if wave3~=.
	replace w`i'=1 if wave3==1 & yr`i'==1
}

*omit 2005
replace w6=0 if wave3~=.


reghdfe std_lt  w1 w2 w3 w4 w5 w6 w7 w8 w9 w10 w11 w12 w13 w14   , absorb(sno year#st) cluster(sno)

estadd ysumm
eststo lights_w3

*label years
forvalue i=1/14{
local j = 1999+`i'
label var w`i' "`j'"
}

*figure output
coefplot (lights_w3, label("Wave 3")) , keep(w*) vertical ytitle(Coefficient on Wave*Year)  ylabel(-.5(.1).5) xlabel(,labsize(small)) yline(0) levels(95) ciopts(lpattern(dash)) omitted baselevels ///
     groups(w1 w2 w3 w4 w5 w6 = `""{bf:Pre-Rollout}" "(No Districts)""'        ///
            w7 w8 w9 = `""{bf:Rollout}" "(Early Dist.)""'                      ///
            w10 w11 w12 w13 w14   = `""{bf:Post-Rollout}" "(All Districts)""')
平行趋势检验2
- 观察政策实施前(2000-2005)的平均街区灯光的增长速度nr08和nr07\nr06之间有无显著差别:
- 结果表明虽然nr08组在2000-2005之间的平均夜间灯光数量显著高于其他两个组别,但是夜间灯光数量增长速度无显著差别,满足平行趋势检验。
*** App Table 2, Panel A.  Association with levels, not trend ***
*****************************************************************
egen std_premean_lt = std(pre_meanlt) //取标准误的意义何在呢
egen std_pregrowth_lt = std(dlt00_05)
**pre-period mean
*col. 1
reghdfe std_premean_lt nr08 if year==2000, absorb(st) cluster(st)
*col. 2
reghdfe std_premean_lt nr08 if year==2000 & wage!=., absorb(st) cluster(st)
**pre-period growth
*col. 3
reghdfe std_pregrowth_lt nr08 if year==2000, absorb(st) cluster(st)
*col. 4
reghdfe std_pregrowth_lt nr08 if year==2000 & wage!=., absorb(st) cluster(st)
异质性检验
- 这篇论文做异质性检验主要是为了验证这项政策的政策效果在更贫困的街区是否效果更糟?
- 这篇论文并不是进行分样本(将样本分为nr06,nr07,nr08)回归来进行异质性检验,而是通过nr06,nr07,nr08样本对nreg的政策效果的调节作用来实现的。


稳健性检验
缩短样本区间
剔除其他政策的影响
- 将受到其他政策影响的样本剔除,再进行基准回归和异质性分析。
Bacon分解
*** Appendix Figures: Goodman-Bacon Decompositions ***
******************************************************
xtset sno year
*App Fig. 1: GB Decomposition, All Waves
bacondecomp std_lt nregs, ddetail
*App. Fig. 2a: GB Decomposition: 2006 & 2007
preserve
drop if nr08==1
bacondecomp std_lt nregs, ddetail
restore

**App. Fig. 2b: GB Decomposition: 2007 & 2008
preserve
drop if nr06==1
bacondecomp std_lt nregs, ddetail
restore

*App. Fig. 2c: GB Decomposition: 2006 & 2008
preserve
drop if nr07==1
bacondecomp std_lt nregs, ddetail
restore
- 进一步学习的参考网址:https://zhuanlan.zhihu.com/p/442004803
