Python机器学习日记4:监督学习算法的一些样本数据集(持续更新)
Python机器学习日记4:监督学习算法的一些样本数据集
- 一、书目与章节
- 二、forge数据集(二分类)
- 三、blobs数据集(三/多分类)
- 四、moons数据集
- 五、wave数据集(回归)
- 六、威斯康星州乳腺癌数据集(二分类)
-
- 1. DESCR
- 2. feature_names
- 3. data
- 4. target_names
- 5. target
- 6. filename
- 7. frame
- 七、波士顿房价数据集(回归)
-
- 1. DESCR
- 2. feature_names
- 3. data
- 4. target
- 5. filename
- 6. 特征工程(小提一嘴)
一、书目与章节
![]()
拜读的是这本《Python机器学习基础教程》,本文选自第2章“监督学习”第3节“监督学习算法中的样本数据集介绍,其中包括:forge数据集、wave数据集、威斯康星州乳腺癌数据集、波士顿房价数据集。
本书电子版链接:https://pan.baidu.com/s/1MTPDFHeD6GVgMX4C_wOZPQ
提取码:ut34
本书全部代码:https://github.com/amueller/introduction_to_ml_with_python
二、forge数据集(二分类)
import mglearn
import matplotlib.pyplot as plt
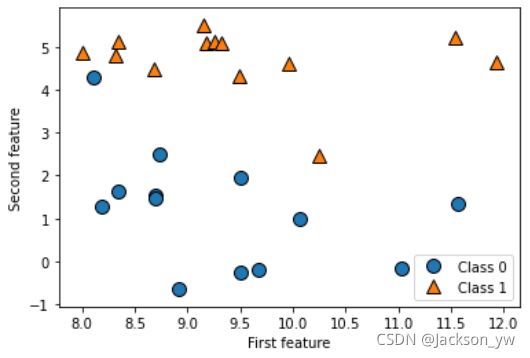
forge数据集是经典的二分类,它有两个特征,调用forge数据集并查看X:
# generate dataset
>>> X, y = mglearn.datasets.make_forge()
>>> X
array([[ 9.96346605,  4.59676542],
       [11.0329545 , -0.16816717],
       [11.54155807,  5.21116083],
       [ 8.69289001,  1.54322016],
       [ 8.1062269 ,  4.28695977],
                   ...
       [ 9.50048972, -0.26430318],
       [ 8.34468785,  1.63824349],
       [ 9.50169345,  1.93824624],
       [ 9.15072323,  5.49832246],
       [11.563957  ,  1.3389402 ]])
X是26*2的数组(26个数据点,2个特征):
>>> X.shape
(26, 2)
查看y,y将对应的X数据分类为0和1:
>>> y
array([1, 0, 1, 0, 0, 1, 1, 0, 1, 1, 1, 1, 0, 0, 1, 1, 1, 0, 0, 1, 0, 0,0, 0, 1, 0])
绘制散点图,第一个特征为x轴,第二个特征为y轴。三角形表示1,圆形表示0:
mglearn.discrete_scatter(X[:, 0], X[:, 1], y) # 绘制散点图
plt.legend(["Class 0", "Class 1"], loc=4) # 图例设置在右下角(第4区域)
plt.xlabel("First feature")
plt.ylabel("Second feature")
三、blobs数据集(三/多分类)
import mglearn
import matplotlib.pyplot as plt
from sklearn.datasets import make_blobs

X, y = make_blobs(random_state = 42)
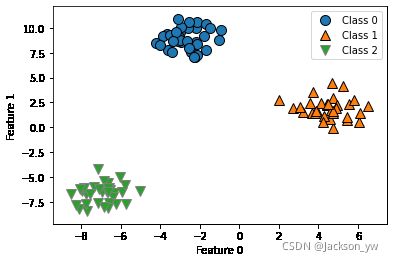
blobs数据集是经典的三分类,它是一个二维数据集,每个类别的数据都是从一个高斯分布中采样得出的,调用数据集并查看X:
>>> X
array([[-7.72642091, -8.39495682],
       [ 5.45339605,  0.74230537],
       [-2.97867201,  9.55684617],
                   ...
       [ 4.47859312,  2.37722054],
       [-5.79657595, -5.82630754],
       [-3.34841515,  8.70507375]])
X是100*2的数组(100个数据点,2个特征):
>> X.shape
(100, 2)
查看y,y将对应的X数据分类为0、1和2:
>>> y
array([2, 1, 0, 1, 2, 1, 0, 1, 1, 0, 0, 2, 2, 0, 0, 2, 2, 0, 2, 2, 0, 2,
       2, 0, 0, 0, 1, 2, 2, 2, 2, 1, 1, 2, 0, 0, 0, 0, 1, 1, 2, 0, 1, 0,
       0, 1, 2, 2, 2, 1, 1, 1, 0, 2, 2, 2, 0, 0, 1, 0, 2, 1, 2, 1, 2, 2,
       1, 2, 1, 1, 1, 2, 2, 0, 1, 2, 1, 2, 1, 1, 0, 1, 0, 2, 0, 0, 0, 1,
       0, 1, 1, 1, 0, 1, 0, 0, 0, 1, 2, 0])
>>> y.shape
(100,)
绘制散点图,第一个特征为x轴,第二个特征为y轴。正三角形表示1,圆形表示0,倒三角形表示2:
mglearn.discrete_scatter(X[:, 0], X[:, 1], y)
plt.xlabel("Feature 0")
plt.ylabel("Feature 1")
plt.legend(["Class 0", "Class 1", "Class 2"])
四、moons数据集
https://blog.csdn.net/Amanda_python/article/details/111577887?spm=1001.2101.3001.6650.1&utm_medium=distribute.pc_relevant.none-task-blog-2%7Edefault%7ECTRLIST%7Edefault-1.no_search_link&depth_1-utm_source=distribute.pc_relevant.none-task-blog-2%7Edefault%7ECTRLIST%7Edefault-1.no_search_link
五、wave数据集(回归)
调用wave数据集并查看X,此处取了40个数据点(不设置默认100点):
>>> X, y = mglearn.datasets.make_wave(n_samples = 40)   # 设置40个数据点
>>> X
array([[-0.75275929],
       [ 2.70428584],
       [ 1.39196365],
       [ 0.59195091],
       [-2.06388816],
       ...
       [ 1.85038409],
       [-1.17231738],
       [-2.41396732],
       [ 1.10539816],
       [-0.35908504]])
X为40*1的数组:
>>> X.shape
(40, 1)
查看y的值:
>>> y
array([-0.44822073,  0.33122576,  0.77932073,  0.03497884, -1.38773632,
       -2.47196233, -1.52730805,  1.49417157,  1.00032374,  0.22956153,
       -1.05979555,  0.7789638 ,  0.75418806, -1.51369739, -1.67303415,
       -0.90496988,  0.08448544, -0.52734666, -0.54114599, -0.3409073 ,
        0.21778193, -1.12469096,  0.37299129,  0.09756349, -0.98618122,
        0.96695428, -1.13455014,  0.69798591,  0.43655826, -0.95652133,
        0.03527881, -2.08581717, -0.47411033,  1.53708251,  0.86893293,
        1.87664889,  0.0945257 , -1.41502356,  0.25438895,  0.09398858])
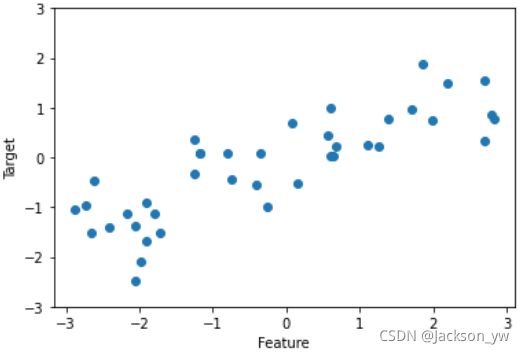
可视化结果如下:
plt.plot(X, y, 'o')
plt.ylim(-3, 3) # 设置y轴坐标为-3到3
plt.xlabel("Feature")
plt.ylabel("Target")
六、威斯康星州乳腺癌数据集(二分类)
该数据集记录了乳腺癌肿瘤的临床测量数据,是一个二分类数据集。
import numpy as np
from sklearn.datasets import load_breast_cancer
cancer = load_breast_cancer()
包含在scikit-learn中的数据集通常被保存为Bunch对象,里面包含真实数据及一些数据集信息。关于Bunch对象,与字典十分相似,并且有一个额外的好处,即可以使用点操作符来访问对象的值(比如用bunch.key来代替bunch[‘key’])
>>> cancer.keys()
dict_keys(['data', 'target', 'frame', 'target_names', 'DESCR', 'feature_names', 'filename'])
1. DESCR
DESCR介绍了数据集的基本情况:
>>> print(cancer['DESCR'][0:3040]+"\n...")
.. _breast_cancer_dataset:

Breast cancer wisconsin (diagnostic) dataset
--------------------------------------------

**Data Set Characteristics:**

    :Number of Instances: 569

    :Number of Attributes: 30 numeric, predictive attributes and the class

    :Attribute Information:
        - radius (mean of distances from center to points on the perimeter)
        - texture (standard deviation of gray-scale values)
        - perimeter
        - area
        - smoothness (local variation in radius lengths)
        - compactness (perimeter^2 / area - 1.0)
        - concavity (severity of concave portions of the contour)
        - concave points (number of concave portions of the contour)
        - symmetry
        - fractal dimension ("coastline approximation" - 1)

        The mean, standard error, and "worst" or largest (mean of the three
        worst/largest values) of these features were computed for each image,
        resulting in 30 features.  For instance, field 0 is Mean Radius, field
        10 is Radius SE, field 20 is Worst Radius.

        - class:
                - WDBC-Malignant
                - WDBC-Benign

    :Summary Statistics:

    ===================================== ====== ======
                                           Min    Max
    ===================================== ====== ======
    radius (mean):                        6.981  28.11
    texture (mean):                       9.71   39.28
    perimeter (mean):                     43.79  188.5
    area (mean):                          143.5  2501.0
    smoothness (mean):                    0.053  0.163
    compactness (mean):                   0.019  0.345
    concavity (mean):                     0.0    0.427
    concave points (mean):                0.0    0.201
    symmetry (mean):                      0.106  0.304
    fractal dimension (mean):             0.05   0.097
    radius (standard error):              0.112  2.873
    texture (standard error):             0.36   4.885
    perimeter (standard error):           0.757  21.98
    area (standard error):                6.802  542.2
    smoothness (standard error):          0.002  0.031
    compactness (standard error):         0.002  0.135
    concavity (standard error):           0.0    0.396
    concave points (standard error):      0.0    0.053
    symmetry (standard error):            0.008  0.079
    fractal dimension (standard error):   0.001  0.03
    radius (worst):                       7.93   36.04
    texture (worst):                      12.02  49.54
    perimeter (worst):                    50.41  251.2
    area (worst):                         185.2  4254.0
    smoothness (worst):                   0.071  0.223
    compactness (worst):                  0.027  1.058
    concavity (worst):                    0.0    1.252
    concave points (worst):               0.0    0.291
    symmetry (worst):                     0.156  0.664
    fractal dimension (worst):            0.055  0.208
    ===================================== ====== =====
...
2. feature_names
查看具体特征:
>>> cancer.feature_names
array(['mean radius', 'mean texture', 'mean perimeter', 'mean area',
       'mean smoothness', 'mean compactness', 'mean concavity',
       'mean concave points', 'mean symmetry', 'mean fractal dimension',
       'radius error', 'texture error', 'perimeter error', 'area error',
       'smoothness error', 'compactness error', 'concavity error',
       'concave points error', 'symmetry error',
       'fractal dimension error', 'worst radius', 'worst texture',
       'worst perimeter', 'worst area', 'worst smoothness',
       'worst compactness', 'worst concavity', 'worst concave points',
       'worst symmetry', 'worst fractal dimension'], dtype=')
3. data
查看具体数据:
>>> cancer.data
array([[1.799e+01, 1.038e+01, 1.228e+02, ..., 2.654e-01, 4.601e-01,
        1.189e-01],
       [2.057e+01, 1.777e+01, 1.329e+02, ..., 1.860e-01, 2.750e-01,
        8.902e-02],
       [1.969e+01, 2.125e+01, 1.300e+02, ..., 2.430e-01, 3.613e-01,
        8.758e-02],
       ...,
       [1.660e+01, 2.808e+01, 1.083e+02, ..., 1.418e-01, 2.218e-01,
        7.820e-02],
       [2.060e+01, 2.933e+01, 1.401e+02, ..., 2.650e-01, 4.087e-01,
        1.240e-01],
       [7.760e+00, 2.454e+01, 4.792e+01, ..., 0.000e+00, 2.871e-01,
        7.039e-02]])
查看数据大小,data为569*30的数组,30分别对应的就是上述特征值:
>>> cancer.data.shape   # 看看数据大小
(569, 30)
4. target_names
查看目标名,分别为malignant(恶性)与benign(良性):
>>> cancer.target_names
array(['malignant', 'benign'], dtype=')
5. target
数据集将target目标分为两类,0与1即恶性与良性:
>>> cancer.target
array([0, 0, 0, 0, 0, 0, 0, 0, 0, 0, 0, 0, 0, 0, 0, 0, 0, 0, 0, 1, 1, 1,
       0, 0, 0, 0, 0, 0, 0, 0, 0, 0, 0, 0, 0, 0, 0, 1, 0, 0, 0, 0, 0, 0,
       0, 0, 1, 0, 1, 1, 1, 1, 1, 0, 0, 1, 0, 0, 1, 1, 1, 1, 0, 1, 0, 0,
       ...
       1, 1, 1, 0, 1, 1, 0, 1, 0, 1, 0, 0, 1, 1, 1, 0, 1, 1, 1, 1, 1, 1,
       1, 1, 1, 1, 1, 0, 1, 0, 0, 1, 1, 1, 1, 1, 1, 1, 1, 1, 1, 1, 1, 1,
       1, 1, 1, 1, 1, 1, 1, 1, 1, 1, 1, 1, 0, 0, 0, 0, 0, 0, 1])
计算下各自的数量,恶性有212例,良性有357例:
>>> {n: v for n, v in zip(cancer.target_names, np.bincount(cancer.target))}   #良性与恶性的个数
{'malignant': 212, 'benign': 357}
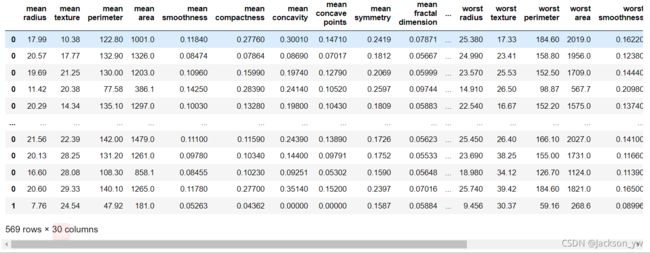
转换为dataframe格式输出看看(画幅有限,部分看不到):
import pandas as pd
X = cancer.data
y = cancer.target
df = pd.DataFrame(X, columns = cancer.feature_names, index = y)
df
6. filename
filename为文件在本地的路径:
>>> cancer.filename
'D:\\Anaconda\\lib\\site-packages\\sklearn\\datasets\\data\\breast_cancer.csv'
7. frame
>>> print(cancer.frame)
None
七、波士顿房价数据集(回归)
波士顿房价数据集通过一系列特征及特征值来预测20世纪70年代波士顿地区房屋价格的中位数
from sklearn.datasets import load_boston
boston = load_boston()
>>> boston.keys()
dict_keys(['data', 'target', 'feature_names', 'DESCR', 'filename'])
1. DESCR
DESCR介绍了数据集的基本情况:
>>> print(boston.DESCR[0:1230]+"\n...")
.. _boston_dataset:

Boston house prices dataset
---------------------------

**Data Set Characteristics:**

    :Number of Instances: 506

    :Number of Attributes: 13 numeric/categorical predictive. Median Value (attribute 14) is usually the target.

    :Attribute Information (in order):
        - CRIM     per capita crime rate by town
        - ZN       proportion of residential land zoned for lots over 25,000 sq.ft.
        - INDUS    proportion of non-retail business acres per town
        - CHAS     Charles River dummy variable (= 1 if tract bounds river; 0 otherwise)
        - NOX      nitric oxides concentration (parts per 10 million)
        - RM       average number of rooms per dwelling
        - AGE      proportion of owner-occupied units built prior to 1940
        - DIS      weighted distances to five Boston employment centres
        - RAD      index of accessibility to radial highways
        - TAX      full-value property-tax rate per $10,000
        - PTRATIO  pupil-teacher ratio by town
        - B        1000(Bk - 0.63)^2 where Bk is the proportion of blacks by town
        - LSTAT    % lower status of the population
        - MEDV     Median value of owner-occupied homes in $1000's
...
2. feature_names
查看特征,共有如下13个:
>>> boston.feature_names
array(['CRIM', 'ZN', 'INDUS', 'CHAS', 'NOX', 'RM', 'AGE', 'DIS', 'RAD',
       'TAX', 'PTRATIO', 'B', 'LSTAT'], dtype=')
| 特征 | 解释 |
|---|---|
| CRIM | 城镇人口犯罪率 |
| ZN | 超过25000平方英尺的住宅用地所占比例 |
| INDUS | 城镇非零售业务地区的比例 |
| CHAS | 查尔斯河虚拟变量(如果土地在河边=1;否则是0) |
| NOX | 一氧化氮浓度(每1000万份) |
| RM | 平均每居民房数 |
| AGE | 在1940年之前建成的所有者占用单位的比例 |
| DIS | 与五个波士顿就业中心的加权距离 |
| RAD | 辐射状公路的可达性指数 |
| TAX | 每10,000美元的全额物业税率 |
| RTRATIO | 城镇师生比例 |
| B | 1000(Bk-0.63)^2其中Bk是城镇黑人的比例 |
| LSTAT | 人口中地位较低人群的百分数 |
3. data
查看数据:
>>> boston.data
array([[6.3200e-03, 1.8000e+01, 2.3100e+00, ..., 1.5300e+01, 3.9690e+02,
        4.9800e+00],
       [2.7310e-02, 0.0000e+00, 7.0700e+00, ..., 1.7800e+01, 3.9690e+02,
        9.1400e+00],
       [2.7290e-02, 0.0000e+00, 7.0700e+00, ..., 1.7800e+01, 3.9283e+02,
        4.0300e+00],
       ...,
       [6.0760e-02, 0.0000e+00, 1.1930e+01, ..., 2.1000e+01, 3.9690e+02,
        5.6400e+00],
       [1.0959e-01, 0.0000e+00, 1.1930e+01, ..., 2.1000e+01, 3.9345e+02,
        6.4800e+00],
       [4.7410e-02, 0.0000e+00, 1.1930e+01, ..., 2.1000e+01, 3.9690e+02,
        7.8800e+00]])
数据为506*13大小:
>>> boston.data.shape
(506, 13)
4. target
波士顿地区房价的中位数:
>>> boston.target
array([24. , 21.6, 34.7, 33.4, 36.2, 28.7, 22.9, 27.1, 16.5, 18.9, 15. ,
       18.9, 21.7, 20.4, 18.2, 19.9, 23.1, 17.5, 20.2, 18.2, 13.6, 19.6,
       15.2, 14.5, 15.6, 13.9, 16.6, 14.8, 18.4, 21. , 12.7, 14.5, 13.2,
       13.1, 13.5, 18.9, 20. , 21. , 24.7, 30.8, 34.9, 26.6, 25.3, 24.7,
       ...
       19.5, 20.2, 21.4, 19.9, 19. , 19.1, 19.1, 20.1, 19.9, 19.6, 23.2,
       29.8, 13.8, 13.3, 16.7, 12. , 14.6, 21.4, 23. , 23.7, 25. , 21.8,
       20.6, 21.2, 19.1, 20.6, 15.2,  7. ,  8.1, 13.6, 20.1, 21.8, 24.5,
       23.1, 19.7, 18.3, 21.2, 17.5, 16.8, 22.4, 20.6, 23.9, 22. , 11.9])
5. filename
filename为文件在本地的路径:
>>> boston.filename
'D:\\Anaconda\\lib\\site-packages\\sklearn\\datasets\\data\\boston_house_prices.csv'
6. 特征工程(小提一嘴)
扩展数据集,除了这13个还需要输入特征之间的乘积(交互项),这些特征两两组合(有放回)得到额外91个特征:
# 特征工程(feature engineering)
>>> X, y = mglearn.datasets.load_extended_boston()
>>> X
array([[0.00000000e+00, 1.80000000e-01, 6.78152493e-02, ...,
        1.00000000e+00, 8.96799117e-02, 8.04248656e-03],
       [2.35922539e-04, 0.00000000e+00, 2.42302053e-01, ...,
        1.00000000e+00, 2.04470199e-01, 4.18080621e-02],
       [2.35697744e-04, 0.00000000e+00, 2.42302053e-01, ...,
        9.79579831e-01, 6.28144504e-02, 4.02790570e-03],
       ...,
       [6.11892474e-04, 0.00000000e+00, 4.20454545e-01, ...,
        1.00000000e+00, 1.07891832e-01, 1.16406475e-02],
       [1.16072990e-03, 0.00000000e+00, 4.20454545e-01, ...,
        9.82676920e-01, 1.29930407e-01, 1.71795127e-02],
       [4.61841693e-04, 0.00000000e+00, 4.20454545e-01, ...,
        1.00000000e+00, 1.69701987e-01, 2.87987643e-02]])
>>> X.shape
(506, 104)
To be continued…


