1、 导包
import numpy as np
import pandas as pd
import matplotlib as mpl
import matplotlib.pyplot as plt
import seaborn as sns
from pylab import mpl
mpl.rcParams['font.sans-serif'] = ['SimHei']
mpl.rcParams['axes.unicode_minus'] = False
2、 条形图–vlines的应用
1、 ymin用来设置起始位置,可以统一设置也可以使用数组分别设置
2、 通过调节linewidth的大小来设置线宽,从而画条形图
3、 linestyle设置线的样式:solid直线(条形图),dashed虚线,dashdot短线,dotted点线
plt.vlines(x=x
,ymin=0
,ymax=y
,linewidth=2
,color='red'
,alpha=0.4
,linestyle='dotted'
);
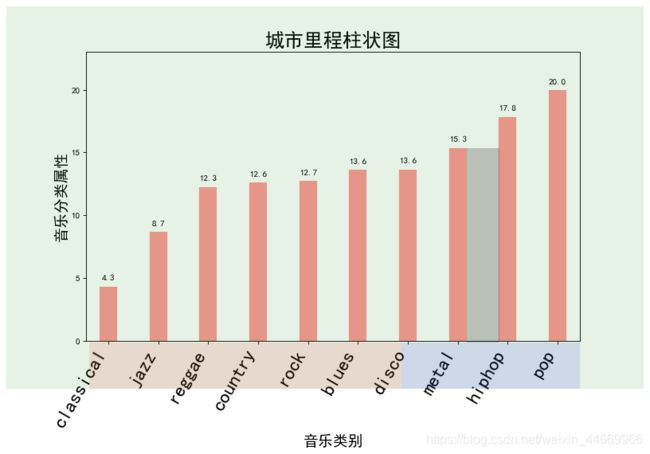
3、 条形图–面向对象可视化
1、 生成画布和子图,在画布上添加多个子图,通过画布来调用画图函数
2、
fig , ax = plt.subplots(figsize=(10,6), facecolor='white',dpi=80)
ax.vlines(x=df.index.values
,ymin=0
,ymax=df.values
,linewidth=20
,color='red'
,alpha=0.4
,linestyle='solid'
)
给条形图上加上数字:参数分别是:x-index,y-index,保留几位有效数字,数组显示位置
for i,label in enumerate (df.values):
ax.text(df.index[i],label+0.5
,np.round(label[0],1)
,horizontalalignment='center')
4、 条形图–样式
set_title:子图命名
set_xlabel和set_ylabel:子图坐标轴命名
set:y轴刻度范围
plt.xticks:x轴刻度及属性
ax.set_title('城市里程柱状图', fontdict={'size':22})
ax.set_xlabel(xlabel='音乐类别',fontdict={'size':17})
ax.set_ylabel(ylabel='音乐分类属性',fontdict={'size':17})
ax.set(ylim=(0,23))
plt.xticks(df.index
,rotation=60
,horizontalalignment='right'
,fontsize=22)
5、 条形图–长方形
1、 定义长方形:patches.Rectangle()
2、 在画布上加入长方形:fig.add_artist(p1)
import matplotlib.patches as patches
p1 = patches.Rectangle((0,0)
,width=1
,height=1
,alpha = .1
,facecolor='green'
,transform=fig.transFigure
)
p2 = patches.Rectangle((0.13,-0.000)
,width=.49
,height=.12
,alpha=.1
,facecolor='red'
,transform=fig.transFigure)
p3 = patches.Rectangle((0.62,-0.000)
,width=.28
,height=.12
,alpha=.1
,facecolor='blue'
,transform=fig.transFigure)
p4 = patches.Rectangle((0.723,.12)
,width=.051
,height=.509
,alpha=.2
,facecolor='black'
,transform=fig.transFigure)
fig.add_artist(p1)
fig.add_artist(p2)
fig.add_artist(p3)
fig.add_artist(p4);

