Python学习——K-means聚类和运用K均值算法对颜色进行量化
K-means的用法 有了Python真的是做什么都方便得很,我们只要知道我们想要用的算法在哪个包中,我们如何去调用就ok了~~
首先,K-means在sklearn.cluster中,我们用到K-means聚类时,我们只需:
from sklearn.cluster import KMeans
K-means在Python的三方库中的定义是这样的:
class sklearn.cluster.KMeans(n_clusters=8, init=’k-means++’, n_init=10, max_iter=300, tol=0.0001, precompute_distances=’auto’, verbose=0, random_state=None, copy_x=True, n_jobs=None, algorithm=’auto’)
各输入参数的含义
n_clusters : int, optional, default: 8
表示的是要生成的簇的数量,或者说聚类中心的数量。是个整型的数,默认值为8;
init : {‘k-means++’, ‘random’ or an ndarray}
表示的是对需要聚类的数据的初始化的方法,默认的方法是’k-means++’.
初始化的方法有三种:k-means++,random,或者是一个数组。
k-means++能智能的选择初始聚类中心进行k均值聚类,加快收敛速度。
random则是从数据中随机的选择k个观测值作为初始的聚类中心。
也可以传递给init一个数组作为初始化的聚类中心,则这个数组的结构应该是(n_clusters, n_features)。
n_init : int, default: 10
表示的是K-means算法选择聚类中心的次数,默认值为10。最终返回的是聚类中心最好的一次结果(好是指时间的长短)。
max_iter : int, default: 300
每次运行K-means算法的最大迭代次数,默认值为300.
tol : float, default: 1e-4
表示的相当于是迭代终止的精度要求,可以允许的误差,当满足这个精度,则聚类收敛,寻找到最优解,可以停止迭代,默认值为10-4。
precompute_distances : {‘auto’, True, False}
预先计算距离,在空间和时间上作出权衡。这样做会更快,但是会占用更多的内存,默认值为‘auto’。
‘auto’指如果n_samples * n_clusters > 12亿时,就不预先计算距离。这样就相当于使用双精度的每个作业大约需要100MB的内存。
‘True’指总是预先计算距离。
‘False’指不预先计算距离。
verbose : int, default 0
是否输出详细信息,默认值为0。
random_state : int, RandomState instance or None (default)
确定聚类中心初始化的随机数生成。使用一个整型的数是的随机性具有确定性,默认值为None。
copy_x : boolean, optional
bool 在scikit-learn 很多接口中都会有这个参数的,就是是否对输入数据继续copy 操作,以便不修改用户的输入数据,默认值为True。为True时,是不修改原始数据,确保X是C-contiguous,聚类后不修改原始数据。为False时,则修改原始数据,在函数返回之前将修改后的放回X,但通过减去再加上数据均值,可能会引入较小的数值差异,在这种情况下,也不能保证数据是C-contiguous,可能会使速度明显的下降。
n_jobs : int or None, optional (default=None)
使用进程的数量,与电脑CPU有关。默认值为None。
algorithm : “auto”, “full” or “elkan”, default=“auto”
K-means算法所用到的,“full”指经典的EM-style算法;“elkan”通过使用三角不等式,所以更高效,但目前不支持稀疏的数据;“auto”则在数据密集时,选择“elkan”,在数据稀疏时,选择“full”。
函数返回值
**cluster_centers_:**聚类中心的坐标。
如果算法还未完全收敛就停止,则将与labels_不一致。
**labels_:**每个点的标签。
**inertia_:**样本到聚类中心的平方和。
**n_iter_:**迭代运行的次数。
| 函数 | 功能 |
|---|---|
| fit(X[, y, sample_weight]) | 计算K-means聚类 |
| fit_predict(X[, y, sample_weight]) | 计算每个样本的集群中心并预测簇索引。 |
| fit_transform(X[, y, sample_weight]) | 计算聚类并将X变换为聚类距离空间。 |
| get_params([deep]) | 获取此估计函数的参数。 |
| predict(X[, sample_weight]) | 预测X中每个样本所属的最近簇。 |
| score(X[, y, sample_weight]) | 与k -均值目标上的X值相反。 |
| set_params(**params) | 设置此估计函数的参数。 |
| transform(X) | 将X变换为一个簇距空间。 |
import time
import numpy as np
import matplotlib.pyplot as plt
from sklearn.cluster import KMeans
from sklearn.metrics.pairwise import pairwise_distances_argmin
from sklearn.datasets import make_blobs
# ######################################
# Generate sample data
np.random.seed(0)
batch_size = 45
centers = [[1, 1], [-1, -1], [1, -1]]
n_clusters = len(centers)
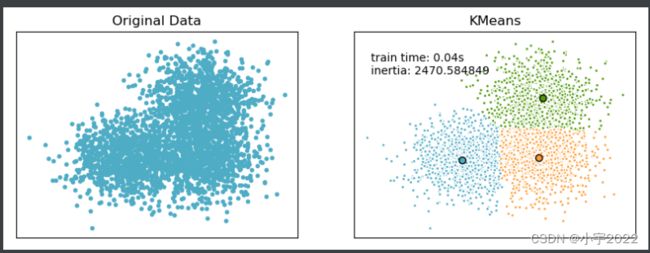
X, labels_true = make_blobs(n_samples=3000, centers=centers, cluster_std=0.7)
# plot result
fig = plt.figure(figsize=(8,3))
fig.subplots_adjust(left=0.02, right=0.98, bottom=0.05, top=0.9)
colors = ['#4EACC5', '#FF9C34', '#4E9A06']
# original data
ax = fig.add_subplot(1,2,1)
row, _ = np.shape(X)
for i in range(row):
ax.plot(X[i, 0], X[i, 1], '#4EACC5', marker='.')
ax.set_title('Original Data')
ax.set_xticks(())
ax.set_yticks(())
# compute clustering with K-Means
k_means = KMeans(init='k-means++', n_clusters=3, n_init=10)
t0 = time.time()
k_means.fit(X)
t_batch = time.time() - t0
k_means_cluster_centers = np.sort(k_means.cluster_centers_, axis=0)
k_means_labels = pairwise_distances_argmin(X, k_means_cluster_centers)
# K-means
ax = fig.add_subplot(1, 2, 2)
for k, col in zip(range(n_clusters), colors):
my_members = k_means_labels == k # my_members是布尔型的数组(用于筛选同类的点,用不同颜色表示)
cluster_center = k_means_cluster_centers[k]
ax.plot(X[my_members, 0], X[my_members, 1], 'w',
markerfacecolor=col, marker='.') # 将同一类的点表示出来
ax.plot(cluster_center[0], cluster_center[1], 'o', markerfacecolor=col,
markeredgecolor='k', marker='o') # 将聚类中心单独表示出来
ax.set_title('KMeans')
ax.set_xticks(())
ax.set_yticks(())
plt.text(-3.5, 1.8, 'train time: %.2fs\ninertia: %f' % (t_batch, k_means.inertia_))
plt.show()
Color Quantization using K-Means Performs a pixel-wise Vector
Quantization (VQ) of an image of the summer palace (China), reducing
the number of colors required to show the image from 96,615 unique
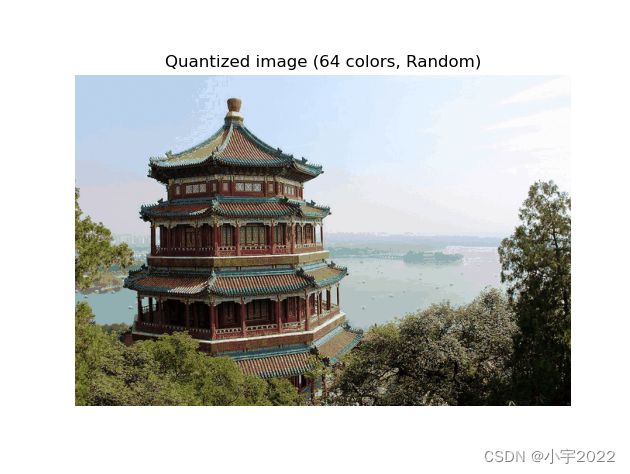
colors to 64, while preserving the overall appearance quality.In this example, pixels are represented in a 3D-space and K-means is
used to find 64 color clusters. In the image processing literature,
the codebook obtained from K-means (the cluster centers) is called the
color palette. Using a single byte, up to 256 colors can be addressed,
whereas an RGB encoding requires 3 bytes per pixel. The GIF file
format, for example, uses such a palette.For comparison, a quantized image using a random codebook (colors
picked up randomly) is also shown.
# Authors: Robert Layton 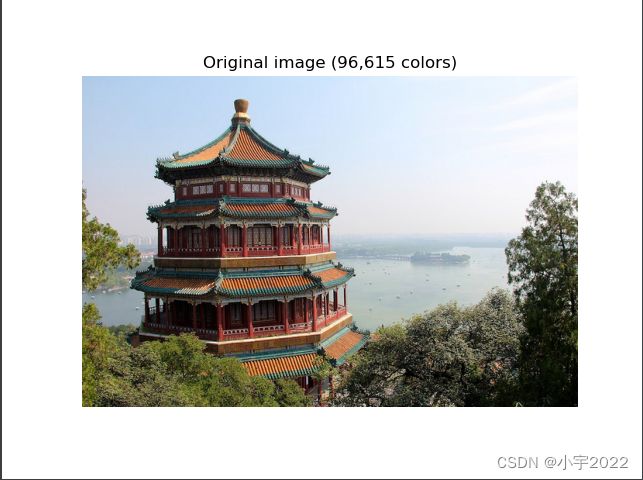

Python学习–K-means聚类
Color Quantization using K-Means