【爆胎预警项目】基于EMD+SVD处理爆胎程序解释
1、数据导入
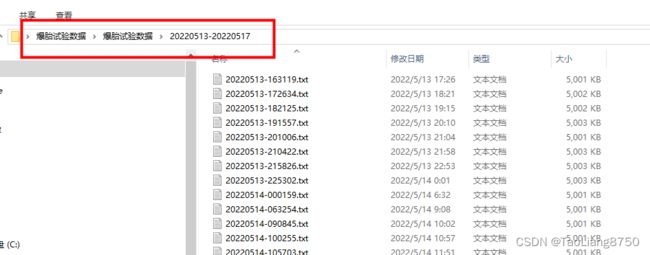
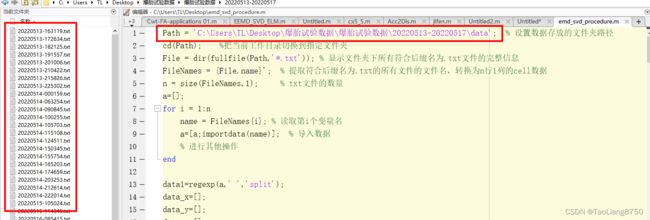
Path = 'C:\Users\TL\Desktop\爆胎试验数据\爆胎试验数据\20220513-20220517';
% 设置数据存放的文件夹路径
cd(Path);    %把当前工作目录切换到指定文件夹
File = dir(fullfile(Path,'*.txt')); % 显示文件夹下所有符合后缀名为.txt文件的完整信息
FileNames = {File.name}';  % 提取符合后缀名为.txt的所有文件的文件名,转换为n行1列的cell数据
n = size(FileNames,1);     % txt文件的数量
a=[];
for i = 1:n
    name = FileNames{i}; % 读取第i个变量名
    a=[a;importdata(name)];  % 导入数据
    % 进行其他操作
end

data1=regexp(a,' ','split');  %将数据按空格分开
data_x=[];
data_y=[];
data_z=[];

for i=1:length(data1)  %分别将数据导入,运行速度有点慢,等待就行
   temp=data1{i,1};
   data_x(i)=str2num(temp{1,8});
   data_y(i)=str2num(temp{1,9});
   data_z(i)=str2num(temp{1,10});

end
以20220513试验为例,我将数据路径替换一下即可
2、数据曲线绘制
n1=length(data_x);
time1=0:0.05:(n1-1)*0.05;
time1=time1';
data_x=data_x';
data_y=data_y';
data_z=data_z';

%原始信号绘制
fg1=figure
fg1.PaperOrientation='landscape';
subplot(1,3,1)
hold on
plot(time1,data_x,"k")
legend("X1")
legend("boxoff")
xlabel("Time/s")
ylabel("Acceleration(g)")


subplot(1,3,2)
hold on
plot(time1,data_y,"k")
legend("Y1")
legend("boxoff")
xlabel("Time/s")
ylabel("Acceleration(g)")

subplot(1,3,3)
hold on
plot(time1,data_z,"k")
legend("Z1")
legend("boxoff")
xlabel("Time/s")
ylabel("Acceleration(g)")
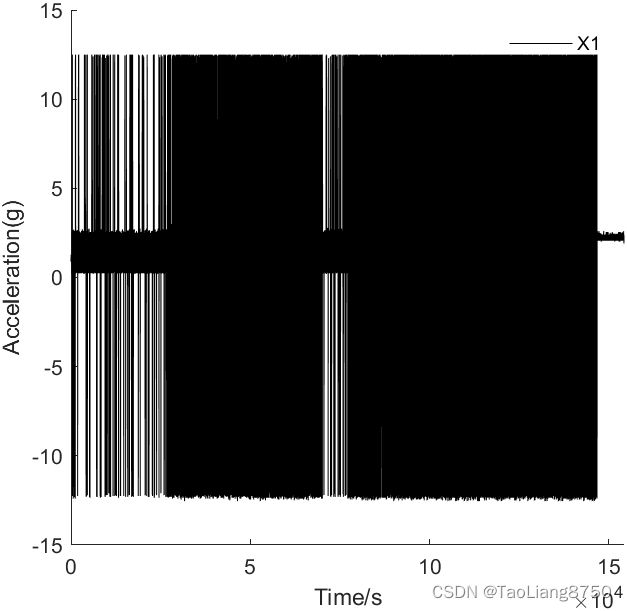
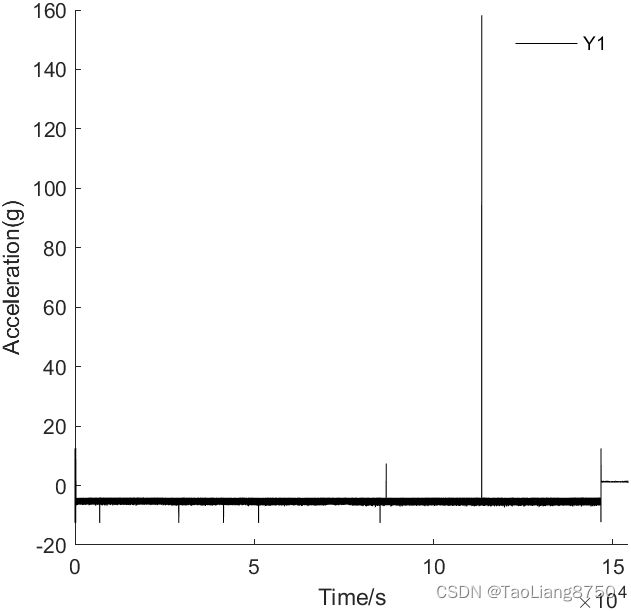
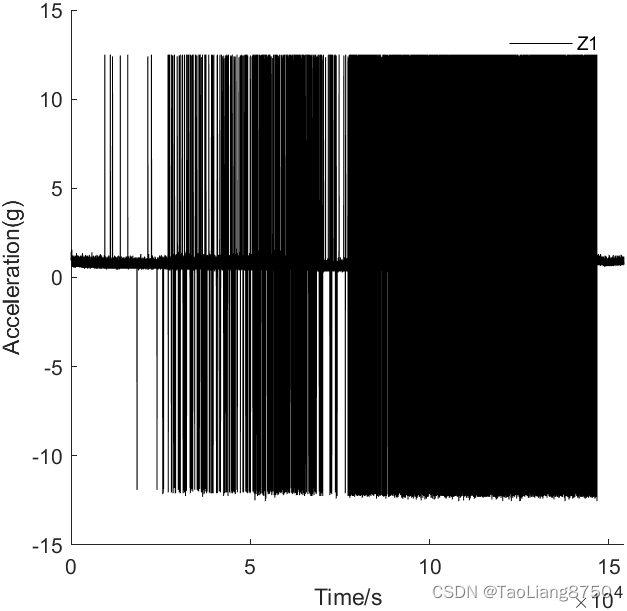
查看原始数据,会发现有些值是离群的,所以需要做离群点处理
(1)X分析原始数据
(2)Y分析原始数据
(3)Z分析原始数据
3、离群点处理
data_x_fill = filloutliers(data_x,'next');  %离群点处理与替换
data_y_fill = filloutliers(data_y,'next');
data_z_fill = filloutliers(data_z,'next');


%绘制预处理结果
fg2=figure
fg2.PaperOrientation='landscape';

subplot(1,3,1)
hold on
% plot(time1,data_x)
% plot(time1,data_x2)
plot(time1,data_x_fill,"k")
xlabel("Time/s")
ylabel("Acceleration(g)")
legend("boxoff")
legend("X")
% axis tight
% legend('原始x','rlowess','filloutliers')

subplot(1,3,2)
hold on
% plot(time1,data_y)
% plot(time1,data_y2)
plot(time1,data_y_fill,"k")
xlabel("Time/s")
ylabel("Acceleration(g)")
legend("boxoff")
legend("Y")
% axis tight
% legend('原始y','rlowess','filloutliers')

subplot(1,3,3)
hold on
% plot(time1,data_z)
% plot(time1,data_z2)
plot(time1,data_z_fill,"k")
xlabel("Time/s")
ylabel("Acceleration(g)")
legend("boxoff")
legend("Z")
% axis tight
% legend('原始z','rlowess','filloutliers')
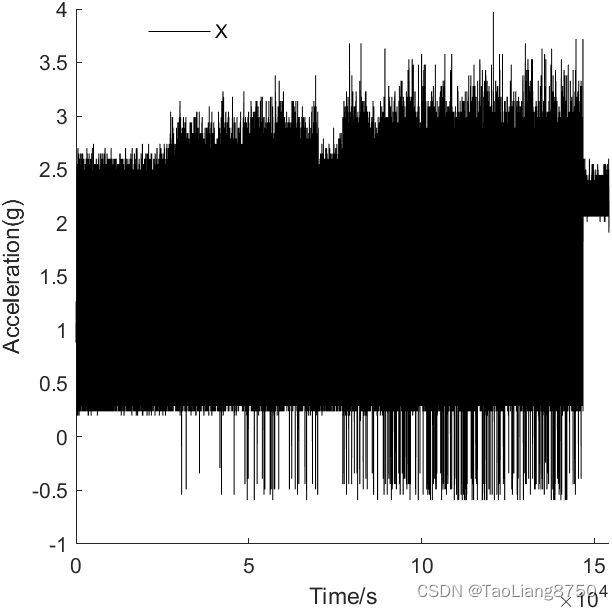
(1)X离群处理后数据
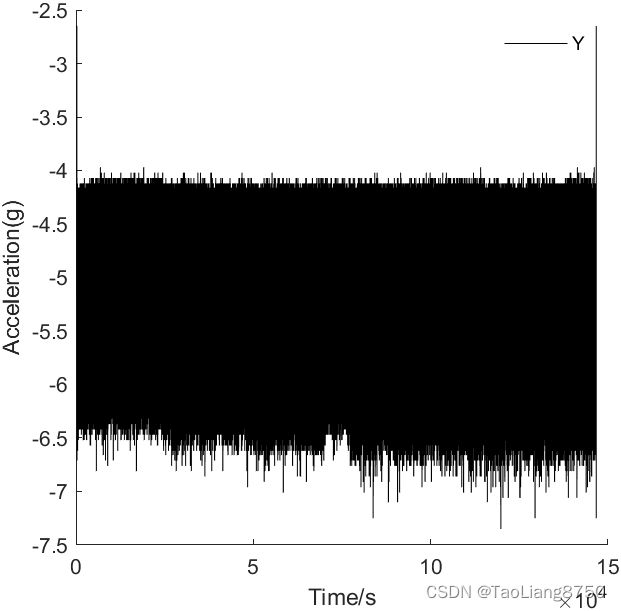
(2)Y离群处理后数据
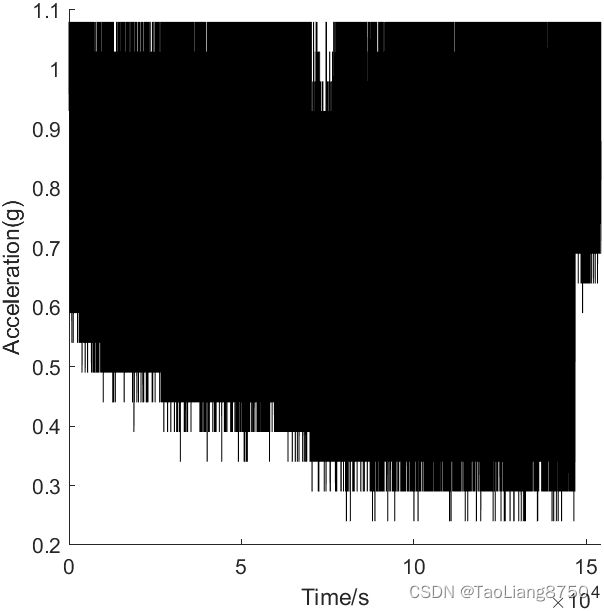
(3)Z离群处理后数据
4、特征提取(分析点与特征数量设置)
test_points=3080000; %测试点个数,根据实际情况定

data_x3=data_x_fill(1:test_points);
data_y3=data_y_fill(1:test_points);
data_z3=data_z_fill(1:test_points);

d1 = 5000; % 分析点数 (d1个点生成一组特征)
d2 =7;  % 特征数量
其中test_points为待分析数据点,比如本次分析中数据点公用3084340,考虑案例中以5000个点取一个特征值,为能相除后结果为整数,故这里待分析数据点设置为3080000。
同时考虑数据点比较多后,电脑能带不动,所以这里设置1000000:3
5、EMD+SVD分解
%% EMD+SVD分解
%emd存储用
A_x = zeros(d2,(test_points/d1));
A_y = zeros(d2,(test_points/d1));
A_z = zeros(d2,(test_points/d1));

for ii = 1:(test_points/d1);
    c = data_x3((d1*(ii-1)+1):d1*ii);
    imf = emd(c);
    [u s v] = svds(imf,d2);
    A_x(:,ii) = diag(s);
end


for ii = 1:(test_points/d1);
    c = data_y3((d1*(ii-1)+1):d1*ii);
    imf = emd(c);
    [u s v] = svds(imf,d2);
    A_y(:,ii) = diag(s);
end

for ii = 1:(test_points/d1);
    c = data_z3((d1*(ii-1)+1):d1*ii);
    imf = emd(c);
    [u s v] = svds(imf,d2);
    A_z(:,ii) = diag(s);
end


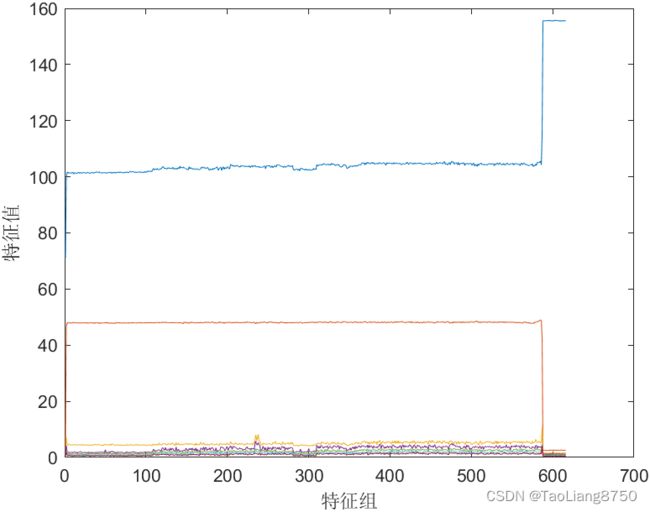
figure
plot(A_x')
xlabel('特征组')
ylabel('特征值')

figure
plot(A_y')
xlabel('特征组')
ylabel('特征值')

figure
plot(A_z')
xlabel('特征组')
ylabel('特征值')
直接运行等待结果即可
如果运行出现下面报错,减少数据分析量即可
X轴:提取的结果,具体结果具体分析。
