机器学习笔记--决策树&决策树可视化
决策树算法/Decision Tree
决策树思想就是找到最纯净的数据划分方法,即要把目标变量分得足够开,使每个节点对应于同一个类别.
在递归过程中有3种情况会导致递归返回:
1.当前节点包含的样本完全属于同一类别;
2.当前属性集为空,或所有样本在所有属性上取值相同;
3.当前节点包含的样本集为空.
其中,从数据集中选择最优划分属性的方法不同对应产生了不同的决策树算法:
ID3算法使用信息增益(多分叉树);
C4.5算法使用信息增益率(连续属性二分类,离散属性可多分类);
CART算法使用基尼系数(二叉树).
信息增益(Information Gain):
在特征A的条件下数据集D的信息增益
g(D,A)=H(D)−H(D|A)
其中, H(D) 为数据集D的熵
H(D)=−∑ni=1pilogpi
H(D|A) 为在特征A的条件下数据集D的条件熵
H(D|A)=∑ni=1piH(D|A=ai)
信息增益率(Information Gain Ratio):
gR(D,A)=g(D,A)H(D)
基尼指数(Gini Index):
在特征A的条件下数据集D的基尼指数
Gini(D,A)=∑ni=1piGini(D|A=ai)
数据集D的基尼指数
Gini(D)=1−∑ki=1p2i
创建决策树
创建决策树并区分:
#!/usr/bin/python
# -*-coding:utf-8-*-

import operator
from math import log

# 计算数据集的信息熵
def Entropy(dataSet):
    # 为所有可能分类创建字典
    labelCounts = {}
    for featVec in dataSet:
        # 当前类别
        currentLabel = featVec[-1]
        # 若当前类别不存在,则在字典labelCounts中加入该键值
        if currentLabel not in labelCounts.keys():
            labelCounts[currentLabel] = 0
        # 记录当前类别出现的次数
        labelCounts[currentLabel] += 1
    entropy = 0.0
    for key in labelCounts:
        # 类别出现的概率=类别出现频次/数据集中的实例总数
        P = float(labelCounts[key])/ len(dataSet)
        # 以2为底取对数
        entropy -= P * log(P, 2)
    return entropy


# 选择列表中出现次数最多的分类
def majorityCnt(classList):
    vote = {}
    # 分别对列表中的元素进行投票统计
    for i in classList:
        vote[i] = vote.get(i, 0) + 1
    classCount = sorted(vote.iteritems(),key= operator.itemgetter(1), reverse=True)
    print classCount[0][0]


# 按照给定特征划分数据集(第axis个特征中的值value)
def splitDataSet(dataSet, axis, value):
    retDataSet = []
    for featVec in dataSet:
        # 若第axis个属性值与value相等
        if featVec[axis] == value:
            # 截取axis之前的特征
            reducedFeatVec = featVec[:axis]
            # 截取axis之后的特征
            reducedFeatVec.extend(featVec[axis+1:])
            retDataSet.append(reducedFeatVec)
    return retDataSet


# 选择最好的数据集划分方式
def chooseBestFeatureToSplit(dataSet):
    # 计算数据集的信息熵
    baseEntropy = Entropy(dataSet)
    bestInfoGain = 0.0
    bestFeature = -1
    # 对所有特征遍历(特征个数=len(dataSet[0]) - 1)
    for i in range(len(dataSet[0]) - 1):
        # 记录第i个特征的所有属性值
        featList = [example[i] for example in dataSet]
        # 利用集合删除list内重复的属性值
        uniqueVals = set(featList)

        # 计算每种划分方式的信息熵
        newEntropy = 0.0
        # 用特征逐个对dataSet进行划分
        for value in uniqueVals:
            subDataSet = splitDataSet(dataSet, i, value)
            prob = len(subDataSet)/float(len(dataSet))
            # 计算划分后数据集的条件熵
            newEntropy += prob * Entropy(subDataSet)
        # 当前划分方式下的信息增益
        infoGain = baseEntropy - newEntropy
        # 记录信息增益最大的划分方式
        if (infoGain > bestInfoGain):
            bestInfoGain = infoGain
            bestFeature = i
    return bestFeature


# 创建树
def createTree(dataSet, labels):
    # 获得输入dataSet的类别列表
    classList = [example[-1] for example in dataSet]
    # 若类别完全相同(即即首个类别在list内的个数=list的长度)则停止划分
    if classList.count(classList[0]) == len(classList):
        # 直接返回该类别
        return classList[0]
    # 遍历完所有特征时返回出现次数最多的
    if len(dataSet[0]) == 1:
        # 选择列表中出现次数最多的分类
        return majorityCnt(classList)
    # 获得信息增益最大的划分方式
    bestFeat = chooseBestFeatureToSplit(dataSet)
    # 划分特征对应的label
    bestFeatLabel = labels[bestFeat]
    # 创建字典
    myTree = {bestFeatLabel:{}}
    # 得到列表包含的所有属性值
    del(labels[bestFeat])
    # 获得当前特征的所有属性值
    featValues = [example[bestFeat] for example in dataSet]
    uniqueVals = set(featValues)
    # 遍历当前特征的所有属性值
    for value in uniqueVals:
        subLabels = labels
        myTree[bestFeatLabel][value] = createTree(splitDataSet(dataSet, bestFeat, value), subLabels)
    return myTree

if __name__ == '__main__':
    mydat = [[1, 1, 'yes'],
             [1, 1, 'yes'],
             [1, 0, 'no'],
             [0, 1, 'no'],
             [0, 1, 'no']]
    labels = ['no surfacing', 'flippers']

    myTree = createTree(mydat, labels)
    print myTree
输出:
{'no surfacing': {0: 'no', 1: {'flippers': {0: 'no', 1: 'yes'}}}}sklearn中应用
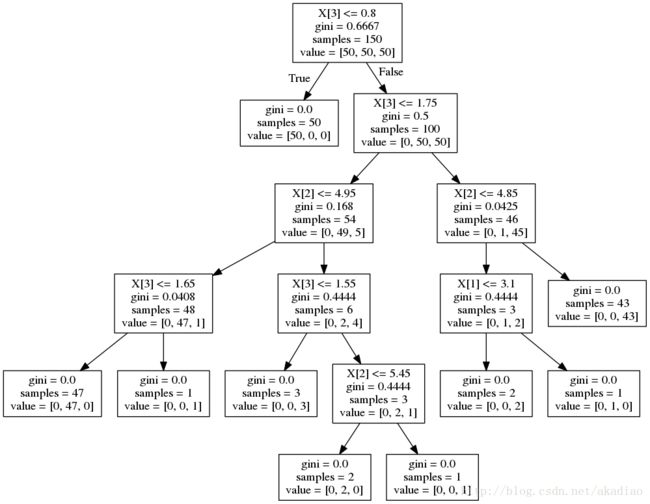
可利用export_graphviz生成.dot文件然后安装graphviz包可转换为图片格式查看生成的决策树结构:
#!/usr/bin/python
# -*-coding:utf-8-*-

from sklearn.datasets import load_iris
from sklearn.model_selection import cross_val_score
from sklearn import tree

# 加载数据集
iris = load_iris()
# 拟合分类器
clf = tree.DecisionTreeClassifier(random_state=0)
clf = clf.fit(iris.data, iris.target)

tree.export_graphviz(clf, out_file='tree.dot')
score = cross_val_score(clf, iris.data, iris.target, cv=10)
print score
输出:
[ 1.          0.93333333  1.          0.93333333  0.93333333  0.86666667
  0.93333333  1.          1.          1.        ]
使用graphviz查看
安装graphviz:
sudo apt-get install graphvizdot -Tpng tree.dot -o tree.png生成图像tree.png为:
使用pydotplus查看:
用pydotplus生成tree.pdf。这样不用再命令行单独生成png/pdf文件了.
安装pydotplus:
pip install pydotplus示例:
#!/usr/bin/python
# -*-coding:utf-8-*-

from sklearn.datasets import load_iris
import pydotplus
from sklearn import tree

# 加载数据集
iris = load_iris()
# 拟合分类器
clf = tree.DecisionTreeClassifier(random_state=0)
clf = clf.fit(iris.data, iris.target)

dot_data = tree.export_graphviz(clf, out_file=None)
graph = pydotplus.graph_from_dot_data(dot_data)
# graph.write_pdf("tree.pdf")
graph.write_png("tre00e.png")


