【R语言】实验三 数据可视化
系列文章目录
实验一 R 语言数据结构、数据导入与数据处理
实验二 基本数据处理
实验三 数据可视化
实验四 数据分析
实验五 综合应用
实验数据
实验数据下载
1. death rate 数据集
选取人类死亡率数据库(HMD,2007),提供了 1951-2005 年瑞典人口信息。这是个多变量的数据集,变量描述如下表:
| Year | 年份 | Age | 年龄 |
| Female_Exp | 女性生存人口数 | Male_Exp | 男性生存人口数 |
| q_female | 女性死亡率 | q_male | 男性死亡率 |
| Female_death | 女性死亡人数 | Male_death | 男性死亡人数 |
| L_female_exp | 对数女性生存人口数 | L_male_exp | 对数男性生存人口数 |
2. House-handle 数据集
选取堪培拉房价交易指数数据,仅通过该数据进行一些可视化分析,数据显示如下表:
| date | 日期 | index | 房价指数(HPI) |
| year | 年 | month | 月 |
提示:以下是本篇文章正文内容
一、实验目的
- 条形图、饼图、直方图、核密度图、箱线图和点图。
- 散点图、气泡图、折线图、相关图、马赛克图。
二、实验内容
题目1
- 通过读取文件 death rate.csv 获取数据保存到 df 中,简单分析数据,获取共有数据多少条,是否有缺失值或是异常值,若存在这样的数据,将这些数据剔除;对于死亡率来说,它的值域是 0
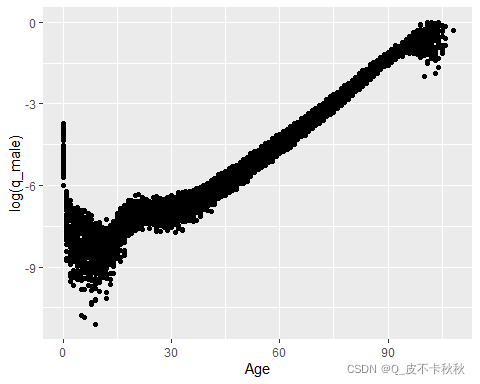
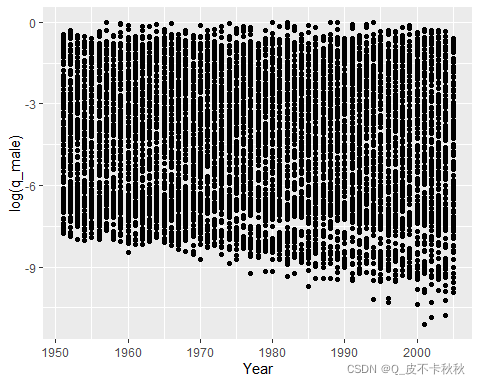
- 绘制散点图,分别展示年龄、年份与男性的死亡率(对数即取 log)的关系。
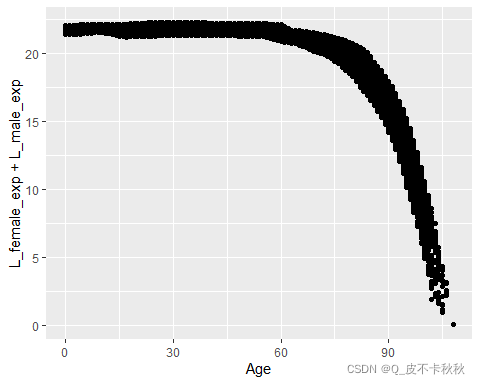
- 绘制年龄与对数生存人数的散点图,分析这 2 个量的关系。
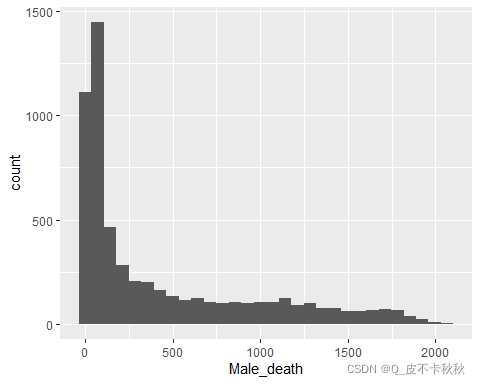
- 绘制直方图来观察一下男性死亡人数的分布。
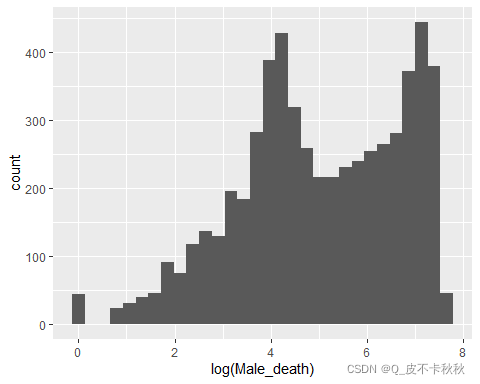
- 绘制男性的对数死亡人数即(Male_death 的对数)的直方图,来观察男性的对数死亡人口数的分布情况。
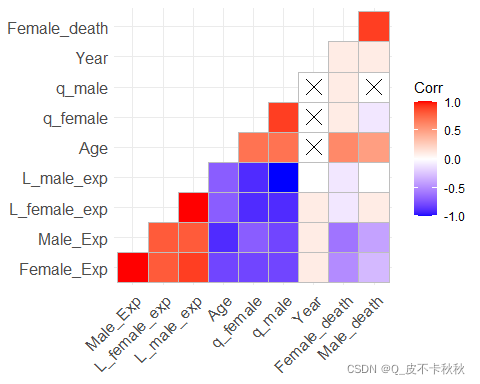
- 计算 df 的各变量的相关系数,并画出相关图。
题目2
- 通过读取文件 House-handle.csv 获取数据保存到 houseIndex 中。
- 数据探索,绘制一张图表来展示 1990 到 2011 年的 HPI 的变化情况,横轴是时间(可以是数据的第一列),纵轴是 HPI 值。
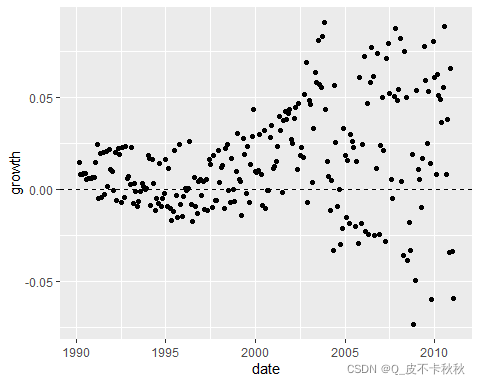
- 绘制一张图,展示每个月的 HPI 的增长量,表示为 delta,在 0 的位置添加参考线。
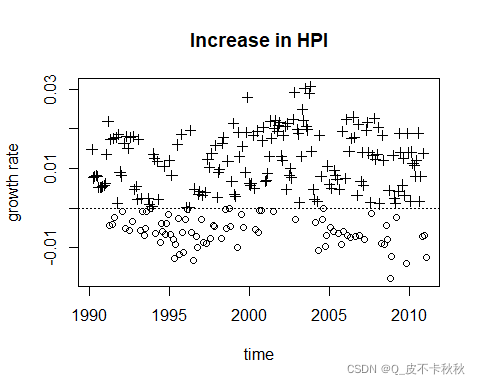
- 为了进一步了解 HPI 的波动,计算其每个月的增长率。绘图时,增长率为正数的月份由加号(“+”)表示,为负的用(“o”)表示。
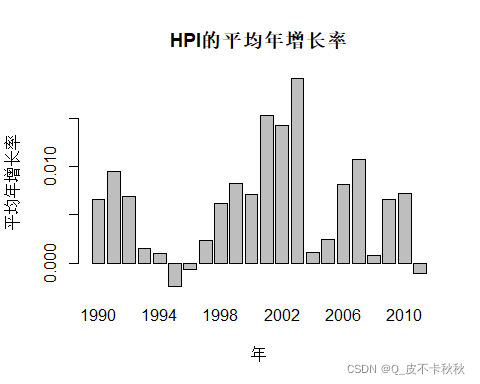
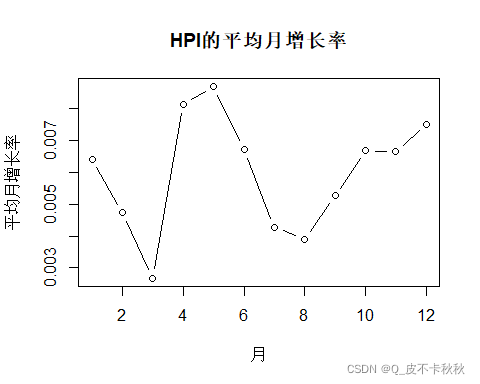
- 对 HPI 增长率建立表格,其中每一行代表一个月份,每一列代表一个年份,显示前四年的数据(HPI 增长率舍入到小数点后 4 位);并绘制一个 HPI 的平均年增长率和 HPI 的平均月增长率(全部年份的年增长率(列平均)和月增长率(行平均))。
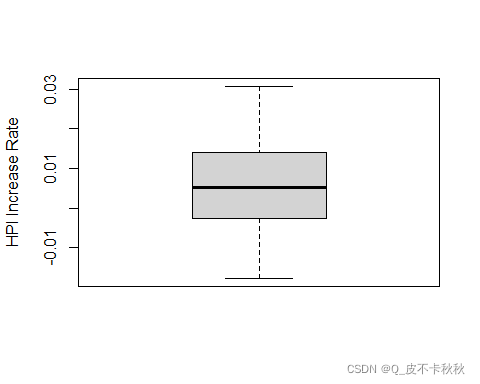
- 绘制一个箱线图,来查看 HPI 的增长率的分布情况。
三、实现过程与实验结果
题目1
1.通过读取文件 death rate.csv 获取数据保存到 df 中,简单分析数据,获取共有数据多少条,是否有缺失值或是异常值,若存在这样的数据,将这些数据剔除;对于死亡率来说,它的值域是 0 2.绘制散点图,分别展示年龄、年份与男性的死亡率(对数即取 log)的关系。 3.绘制年龄与对数生存人数的散点图,分析这 2 个量的关系。 4.绘制直方图来观察一下男性死亡人数的分布。 5.绘制男性的对数死亡人数即(Male_death 的对数)的直方图,来观察男性的对数死亡人口数的分布情况。 6.计算 df 的各变量的相关系数,并画出相关图。 1.通过读取文件 House-handle.csv 获取数据保存到 houseIndex 中。 2.数据探索,绘制一张图表来展示 1990 到 2011 年的 HPI 的变化情况,横轴是时间(可以是数据的第一列),纵轴是 HPI 值。 3.绘制一张图,展示每个月的 HPI 的增长量,表示为 delta,在 0 的位置添加参考线。(增长量用下一条减上一条来计算;第一条的上一条的 HPI 值可以认为是 1)。 4.为了进一步了解 HPI 的波动,计算其每个月的增长率。绘图时,增长率为正数的月份由加号(“+”)表示,为负的用(“o”)表示。 5.对 HPI 增长率建立表格,其中每一行代表一个月份,每一列代表一个年份,显示前四年的数据(HPI 增长率舍入到小数点后 4 位);并绘制一个 HPI 的平均年增长率和 HPI 的平均月增长率(全部年份的年增长率(列平均)和月增长率(行平均))。 6.绘制一个箱线图,来查看 HPI 的增长率的分布情况。# 读取数据保存到df中
df <-
read.csv("R\\data\\ex3\\death rate.csv")
# 数据行数
dim(df)[1]
## [1] 6105
# 缺失值行数
sum(rowSums(is.na(df)) > 0)
## [1] 240
# 剔除缺失行
df <- na.omit(df)
# 数据行数
nrow(df)
## [1] 5865
# 死亡率异常行数
nrow(df) - nrow(df[df$q_male > 0 & df$q_male <= 1,])
## [1] 133
# 剔除异常值行
df <- df[df$q_male > 0 & df$q_male <= 1,]
# 数据行数
length(df[, 1])
## [1] 5732
# 年龄与男性的死亡率散点图
# plot
plot(df$Age, log(df$q_male))
# qplot
qplot(
   x = Age,
   y = log(q_male),
   data = df,
   geom = "point"
 )
# ggplot2
library(ggplot2)
p <- ggplot(data = df, mapping = aes(x = Age, y = log(q_male)))
p + geom_point()
# 年份与男性的死亡率散点图
# plot
plot(df$Year, log(df$q_male))
# qplot
 qplot(
   x = Year,
   y = log(q_male),
   data = df,
   geom = "point"
)
# ggplot2
p <- ggplot(data = df, mapping = aes(x = Year, y = log(q_male)))
p + geom_point()
# 年龄与对数生存人数的散点图
# plot
plot(df$Age, df$L_female_exp + df$L_male_exp)
# qplot
qplot(
   x = Age,
   y = L_female_exp + L_male_exp,
   data = df,
   geom = "point"
)
# ggplot2
p <-
  ggplot(data = df, mapping = aes(x = Age, y = L_female_exp + L_male_exp))
p + geom_point()
# 男性死亡人数的分布直方图
hist(df$Male_death, breaks = 100)
# qplot
qplot(Male_death,
      data = df,
      geom = "histogram",
      bins = 30)
# ggplot2
p1 <- ggplot(df, aes(x = Male_death))
p1 + geom_histogram(bins = 30)
# 男性的对数死亡人数的分布直方图
hist(log(df$Male_death))
# qplot
qplot(log(Male_death),
      data = df,
      geom = "histogram",
      bins = 30)
# ggplot2
p1 <- ggplot(df, aes(x = log(Male_death)))
p1 + geom_histogram(bins = 30)
library(corrgram)
# 相关系数
corr <- round(cor(df), 1)
corr
# 相关图
corrgram(
  df,
  order = TRUE,
  lower.panel = panel.shade,
  upper.panel = panel.pie,
  text.panel = panel.txt,
  main = "Corrgram of df intercorrelations"
)
# install.packages("GGally")
library(GGally)
ggcorr(
  df,
  nbreaks = 5,
  palette = "RdGy",
  label = TRUE,
  label_color = "white",
  hjust = 0.75,
  color = "grey50"
)
# install.packages("ggcorrplot")
library(ggcorrplot)
# 计算p值
p.mat <- cor_pmat(df)
# 重排矩阵,使用分等级聚类
ggcorrplot(corr,
           hc.order = TRUE,
           type = "lower",
           p.mat = p.mat)
题目2
houseIndex <-
  read.csv("R\\data\\ex3\\House-handle.csv")
# 将字符串转换成时间戳的时候,即使格式正确,也会出现将字符串转换成NA的情况,因为Rstudio的默认编码问题导致的,通过下述方法改变编码格式
Sys.setlocale("LC_TIME", "English")
## [1] "English_United States.1252"
# 查看date的格式
head(houseIndex$date)
## [1] "28-Feb-90" "31-Mar-90" "30-Apr-90" "31-May-90" "30-Jun-90" "31-Jul-90"
# data数据类型
class(houseIndex$date)
## [1] "character"
# date转换格式
houseIndex$date <- as.Date(houseIndex$date, "%d-%b-%y")
# 查看date的格式
head(houseIndex$date)
## [1] "1990-02-28" "1990-03-31" "1990-04-30" "1990-05-31" "1990-06-30"
## [6] "1990-07-31"
# 绘图
# plot
plot(houseIndex$date,
     houseIndex$index,
     type = "l",
     main = "HIP(Canberra) 1990-2011")
# qplot
qplot(
  x = date,
  y = index,
  data = houseIndex,
  geom = "line"
)
# ggplot2
ggplot(data = houseIndex, mapping = aes(x = date, y = index)) + geom_line()
# 上个月
houseIndex$rate <- which(houseIndex$index == houseIndex$index) - 1
# 第一个月
houseIndex$rate[1] <- 1
# 增长量 = 这个月的HPI-上个月的HPI
houseIndex$growth <-
  houseIndex$index - houseIndex$index[houseIndex$rate]
# 第一个月的增长量 = 这个月的HPI - 1
houseIndex$growth[1] <- houseIndex$index[1] - 1
# 绘图
# plot
plot(
  houseIndex$date,
  houseIndex$growth,
  type = "p",
  main = "Increase in HPI",
  xlab = "time",
  ylab = "growth"
)
abline(h = 0, lty = 3)
# qplot
qplot(x = date,
      y = growth,
      data = houseIndex,
      geom = "point")
# ggplot2
ggplot(data = houseIndex, mapping = aes(x = date, y = growth)) + geom_point() + geom_hline(aes(yintercept = 0), linetype = "dashed")
# 增长率 = (这个月的HPI-上个月的HPI) / 上个月的HPI
houseIndex$percentage <- houseIndex$growth / houseIndex$index[houseIndex$rate]
# 第一个月的增长率 = (这个月的HPI - 1) / 1
houseIndex$percentage[1] <- houseIndex$growth[1] / 1
# 绘图
# plot
plot(
  houseIndex$date,
  houseIndex$percentage,
  type = "n",
  main = "Increase in HPI",
  xlab = "time",
  ylab = "growth rate"
)
abline(h = 0, lty = 3)
# 增长率为正数
points(houseIndex$date[houseIndex$percentage >= 0], houseIndex$percentage[houseIndex$percentage >= 0], pch = 3)
# 增长率为负数
points(houseIndex$date[houseIndex$percentage < 0], houseIndex$percentage[houseIndex$percentage < 0], pch = 1)
# plot
houseIndex$size[houseIndex$percentage >= 0] <- 3
houseIndex$size[houseIndex$percentage < 0] <- 1
# 绘图
plot(
  houseIndex$date,
  houseIndex$percentage,
  type = "p",
  pch = houseIndex$size,
  main = "Increase in HPI",
  xlab = "time",
  ylab = "growth rate"
)
abline(h = 0, lty = 3)
# HPI增长率表格
table <- xtabs(percentage ~ month + year, data = houseIndex)
round(table[, 1:4], digits = 4)
##      year
## month    1990    1991    1992    1993
##    1   0.0000  0.0134 -0.0007  0.0172
##    2   0.0147  0.0219  0.0164 -0.0057
##    3   0.0076 -0.0043 -0.0050  0.0023
##    4   0.0080  0.0174  0.0180 -0.0007
##    5   0.0082 -0.0041  0.0151 -0.0069
##    6   0.0079  0.0176 -0.0057 -0.0051
##    7   0.0052 -0.0025  0.0178 -0.0008
##    8   0.0053  0.0179 -0.0034  0.0023
##    9   0.0053  0.0013  0.0180  0.0010
##    10  0.0055  0.0186  0.0046 -0.0001
##    11  0.0058  0.0091  0.0055  0.0004
##    12  0.0061  0.0081  0.0021  0.0136
# HPI平均年增长率
yearmean <- colMeans(table)
barplot(yearmean,
        main = "HPI的平均年增长率",
        xlab = "年",
        ylab = "平均年增长率")
# HPI平均月增长率
mouthmean <- rowMeans(table)
plot(
  1:12,
  mouthmean,
  type = "b",
  main = "HPI的平均月增长率",
  xlab = "月",
  ylab = "平均月增长率"
)
boxplot(table,ylab="HPI Increase Rate")
四、总结
以上就是全部内容。
