快速了解Logistic Regression原理及实践
一、Logistic Regression 算法
Logistic Regression 算法具有复杂度低、容易实现的优点,我们可以利用 Logistic Regression 算法实现广告的点击率估计。Logistic Regression 模型是线性的分类的模型,所谓线性通俗的来说只需要一条直线就可以将不同的类区分开来。这条直线也成为超平面,使用
![]()
表示,其中W为权重,b为偏置。
在 Logistic Regression 算法中对样本进行分类,可以通过对训练样本的学习得到超平面,是数据分为正负两个类别。也可以使用阈值函数如 Sigmoid,将样本映射到不同的类别中。
二、Sigmoid 函数
Sigmoid 函数的形式:
![]()
Sigmoid 函数的基本性质:
- 定义域:(−∞,+∞)
- 值域:(−1,1)
- 函数在定义域内为连续和光滑函数
- 处处可导,导数为:f′(x)=f(x)(1−f(x))
Python 实现 Sigmoid 函数如下:
import matplotlib.pyplot as plt

import numpy as np

def  sigmoid(x):

    return 1.0 / (1.0 + np.exp(-x))

x = np.linspace(-10,10)

y = sigmoid(x)

plt.plot(x,y,label="Sigmoid",color = "blue")

plt.legend()
三、那为什么使用 Sigmoid ? 有如下两种解释
(一)Logistic Regression 算法的需求
Logistic Regression 算法中属于正例即输入向量 X 的概率为 :
P(y=1|x,w,b)=Sigmoid(Wx+b)
负例的概率为 :
P(y=0|x,w,b)=1-P(y=1|x,w,b)
对于一个有效的分类器,Wx+b ( w 和 x 的内积)代表了数据 x 属于正类(y=1)的置信度。Wx+b 越大,这个数据属于正类的可能性越大, Wx+b 越小,属于反类的可能性越大。而 Sigmoid 函数恰好能够将 Wx+b 映射到条件概率P(y=1|x,w,b) 上。Sigmoid 函数的值域是(0,1),满足概率的要求,同时它是一个单调上升函数。最终, P(y=1|x,w,b)=Sigmoid(Wx+b),sigmoid的这些良好性质恰好能满足 Logistic Regression 的需求。
(二)Sigmoid 函数和正态分布函数的积分形式形状非常类似。但计算正态分布的积分函数,计算代价非常大,而Sigmoid由于其公式简单,计算量非常的小。总之是 Sigmoid 函数能满足分类任务,至于其他的也不要纠结,很多人都在用就不要苦恼了。
四、求参数W和b
为求参数 W 和 b, 使用极大似然法,通常使用 Log 似然函数的极大值求解参数,在 Logistic Regression 中将负的 Log 似然函数作为损失函数 ![]() 。
。
我们一般使用均方误差来衡量损失函数,但考虑均方误差损失函数一般是非凸函数,其在使用梯度下降算法的时候,容易得到局部最优解,不是全局最优解, 如下图所示:
非凸函数 凸函数
所以要选择凸函数,再者使用均方误差其偏导值在输出概率值接近0或者接近1的时候非常小,这可能会造成模型刚开始训练时,偏导值几乎消失,所以 Logistic Regression 算法选择交叉熵损失函数。
定义如下:
假设训练数据有 m 个训练样本,,则损失函数为:
所以我们的问题变成:
![]()
五、梯度下降法
理清之后我们使用梯度下降的优化算法对损失函数 l 进行优化,寻找最优的参数 W。梯度下降法是一种迭代型的算法,根据初始点在每一次迭代的工程中选择下降方向,同时改变需要修改的参数。
梯度下降法的过程如下:
- 随机选择一个初始点
- 重复下面的步骤:
3. 直到满足终止条件
梯度下降法的更新公式:
![]()
公式推导如下图:
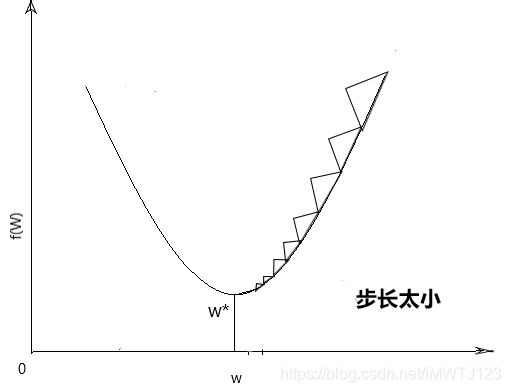
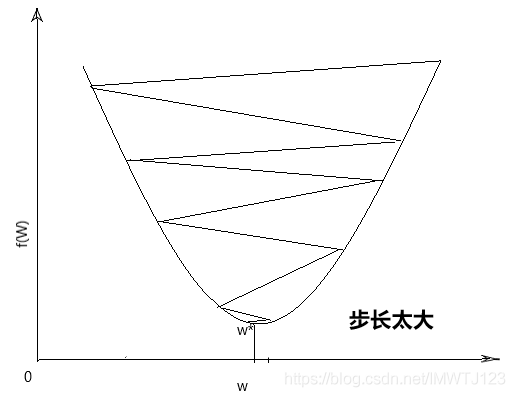
其中a为步长,选择太小会导致收敛速度很慢,选择太大会直接跳过最优解,如下图所示,所以步长的选择至关重要,负的梯度方向为下降方向。
六、 Logistic Regression 算法应用
# -*- coding: utf-8 -*-
from sklearn.datasets import load_iris

import matplotlib.pyplot as plt

import numpy as np

iris = load_iris()

data = iris.data

target = iris.target

X = data[0:100,[0,2]]

y = target[0:100]

label = np.array(y)

index_0 = np.where(label==0)

class logistic(object):

    def __init__(self):

        self.W = None

    def train(self,X,y,learn_rate = 0.01,num_iters = 5000):

        num_train,num_feature = X.shape

        #init the weight

        self.W = 0.001*np.random.randn(num_feature,1).reshape((-1,1))

        loss = []

        for i in range(num_iters):

            error,dW = self.compute_loss(X,y)

            self.W += -learn_rate*dW

            loss.append(error)

        return loss

    def compute_loss(self,X,y):

        num_train = X.shape[0]

        h = self.output(X)

        loss = -np.sum((y*np.log(h) + (1-y)*np.log((1-h))))

        loss = loss / num_train

        dW = X.T.dot((h-y)) / num_train

        return loss,dW

    def output(self,X):

        g = np.dot(X,self.W)

        return self.sigmod(g)

    def sigmod(self,X):

        return 1/(1+np.exp(-X))

    def predict(self,X_test):

        h = self.output(X_test)

        y_pred = np.where(h>=0.5,1,0)

        return y_pred

y = y.reshape((-1,1))

#add the x0=1

one = np.ones((X.shape[0],1))

X_train = np.hstack((one,X))

classify = logistic()

loss = classify.train(X_train,y)

plt.plot(loss)

plt.xlabel('Iteration number')

plt.ylabel('Loss value')

plt.show()

label = np.array(y)

index_0 = np.where(label==0)

plt.scatter(X[index_0,0],X[index_0,1],marker='x',color = 'y',label = '0',s = 12)

index_1 =np.where(label==1)

plt.scatter(X[index_1,0],X[index_1,1],marker='o',color = 'b',label = '1',s = 12)

x1 = np.arange(4,7.5,0.5)

x2 = (- classify.W[0] - classify.W[1]*x1) / classify.W[2]

plt.plot(x1,x2,color = 'black')

plt.xlabel('X1')

plt.ylabel('X2')

plt.legend(loc = 'upper left')

plt.show()
参考文献:
赵志勇《Python 机器学习算法》
Coursera机器学习课程


