python matplotlib 画图时坐标轴重叠,显示不全和图片保存时不完整的问题
问题
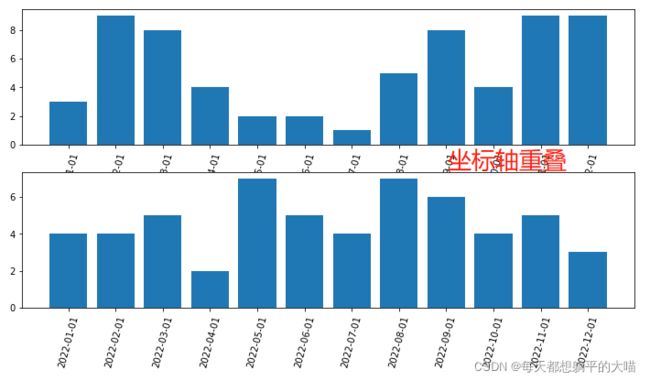
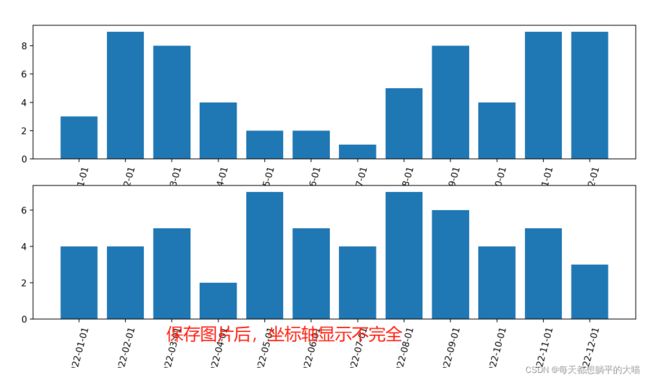
在使用matplotlib作图的时候,有的时候会遇到画图时坐标轴重叠,显示不全和图片保存时不完整的问题。如下:
解决方案
画图时重叠或者显示不全的问题
- 画图时加上参数设置
tight_layout=True - 画完所有子图后,设置
plt.tight_layout()
# 加上tight_layout=True 参数设置
fig, axes = plt.subplots(nrows=2, ncols=1, figsize=(12,6), tight_layout=True)
labels = ['2022-{}-01'.format(str(i).zfill(2)) for i in range(1,13)]
y1 = np.random.randint(low=1, high=10, size=12)
y2 = np.random.randint(low=1, high=10, size=12)
axes[0].bar(labels, y1)
axes[0].set_xticks(labels)
axes[0].set_xticklabels(labels, rotation=75)
axes[1].bar(labels, y2)
axes[1].set_xticks(labels)
axes[1].set_xticklabels(labels, rotation=75)
plt.savefig('test.png', dpi=200)
fig, axes = plt.subplots(nrows=2, ncols=1, figsize=(12,6))
labels = ['2022-{}-01'.format(str(i).zfill(2)) for i in range(1,13)]
y1 = np.random.randint(low=1, high=10, size=12)
y2 = np.random.randint(low=1, high=10, size=12)
axes[0].bar(labels, y1)
axes[0].set_xticks(labels)
axes[0].set_xticklabels(labels, rotation=75)
axes[1].bar(labels, y2)
axes[1].set_xticks(labels)
axes[1].set_xticklabels(labels, rotation=75)
plt.tight_layout()
# 这里加上plt.tight_layout(),记住要在画完所有子图后
plt.savefig('test.png', dpi=200)
效果如下:

保存时图片不完整的问题
- 在plt.savefig中加入bbox_inches='tight’参数设置
fig, axes = plt.subplots(nrows=2, ncols=1, figsize=(12,6), tight_layout=True)
labels = ['2022-{}-01'.format(str(i).zfill(2)) for i in range(1,13)]
y1 = np.random.randint(low=1, high=10, size=12)
y2 = np.random.randint(low=1, high=10, size=12)
axes[0].bar(labels, y1)
axes[0].set_xticks(labels)
axes[0].set_xticklabels(labels, rotation=75)
axes[1].bar(labels, y2)
axes[1].set_xticks(labels)
axes[1].set_xticklabels(labels, rotation=75)
plt.savefig('test.png', dpi=600, bbox_inches='tight')
# savefig时加入bbox_inches='tight'参数设置