鸢尾花分类与直方图、散点图的绘制及可视化决策树
一、IRIS鸢尾花
- 鸢尾花有三个亚属,分别是山鸢尾(Iris-setosa)、变色鸢尾(Iris-versicolor)和维吉尼亚鸢尾(Iris-virginica)
- 数据集一共包含4个特征变量,1个类别变量。共有150个样本,iris是鸢尾植物,这里存储了其萼片和花瓣的长宽,共4个属性,鸢尾植物分三类。

二、IRIS数据集
| 列名 | 说明 | 类型 |
|---|---|---|
| SepalLength | 花萼长度 | float |
| SepalWidth | 花萼宽度 | float |
| PetalLength | 花瓣长度 | float |
| PetalWidth | 花瓣宽度 | float |
| Class | 类别变量。0表示山鸢尾,1表示变色鸢尾,2表示维吉尼亚鸢尾 | int |
三、实验环境
Jupyter-notebook、Scikit-learn
四、实验内容
- 绘制各维度直方图
- 绘制各维度散点图矩阵
- 训练决策树模型(尝试不同决策树参数对分类准确度的影响)
- 可视化决策树
五、实验代码和结果截图
1、导入Python包
import graphviz
import numpy as np
import pandas as pd
import matplotlib.pyplot as plt
from sklearn import tree
from sklearn.datasets import load_iris
from sklearn.tree import export_graphviz
from sklearn.model_selection import train_test_split
2、全局变量
iris = load_iris()# 载入鸢尾花数据集
datas = iris.data# (150,4):150 行 5 列
# print(datas)
# print(iris.target)
x1 = [x[0] for x in datas]# 第1列:花萼长度 sepal_length
x2 = [x[1] for x in datas]# 第2列:花萼宽度 sepal_width
x3 = [x[2] for x in datas]# 第3列:花瓣长度 petal_length
x4 = [x[3] for x in datas]# 第4列:花瓣宽度 petal_width
3、均分样本的散点图,仅花萼长度和花萼宽度
plt.scatter(x1[:50], x2[:50], color='red', marker='o', label='setosa') # 前50个样本
plt.scatter(x1[50:100],x2[50:100],color='blue',marker='x',label='vericolor')# 中间50个样本
plt.scatter(x1[100:150],x2[100:150],color='green',marker='+',label='Virginica')# 后50个样本
plt.legend(loc=1)# loc=1,2,3,4分别表示label在右上角,左上角,左下角,右下角
plt.show()
4、绘制各维度直方图
# 单个直方图
# sepal_length 直方图
plt.hist(x1)
plt.xlabel("sepal_length")
plt.ylabel("sepal_length")
plt.show()
# sepal_width 直方图
plt.hist(x2)
plt.xlabel("sepal_width")
plt.ylabel("sepal_width")
plt.show()
# petal_length 直方图
plt.hist(x3)
plt.xlabel("petal_length")
plt.ylabel("petal_length")
plt.show()
# petal_width 直方图
plt.hist(x4)
plt.xlabel("petal_width")
plt.ylabel("petal_width")
plt.show()


5、各维度直方图合为一图
# 四合一
plt.hist(x1)
plt.hist(x2)
plt.hist(x3)
plt.hist(x4)
plt.show()
6、绘制各维度散点图矩阵
# 单个散点图(其他的同理)
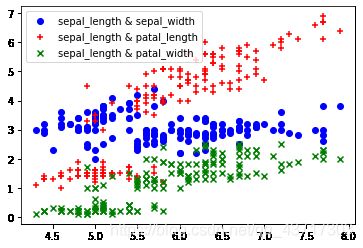
plt.scatter(x1,x2,color='blue',marker='o',label='sepal_length & sepal_width')
plt.scatter(x1,x3,color='red',marker='+',label='sepal_length & petal_length')
plt.scatter(x1,x4,color='green',marker='x',label='sepal_length & petal_width')
plt.legend(loc=2)
plt.show()
7、直方图散点图
# 直方图、散点图
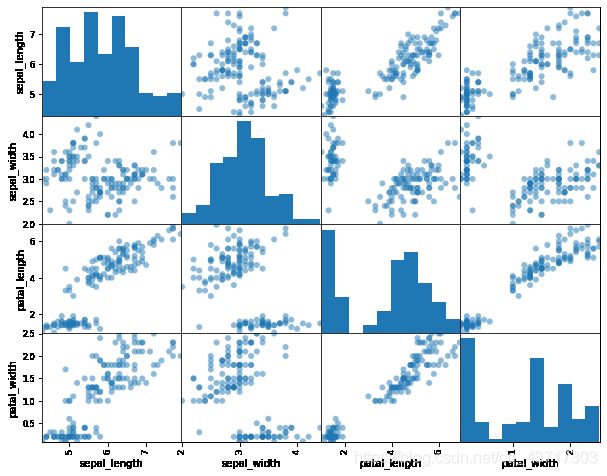
irisdf = pd.DataFrame(datas,columns=['sepal_length','sepal_width','petal_length','petal_width'])
pd.plotting.scatter_matrix(irisdf,alpha = 0.5,
                           figsize =(10,8) ,grid = False,
                           diagonal = 'hist',marker = 'o',
                           range_padding = 0.01)
plt.show()
8、训练决策树模型(尝试不同决策树参数对分类准确度的影响)
x_true = iris.data
y_true = iris.target

# 一般划分比例:测试集约为1/3
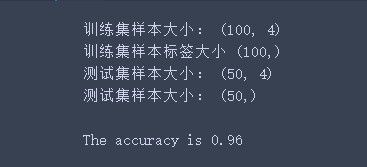
x_train,x_test,y_train,y_test = train_test_split(x_true,y_true,test_size=0.33)

# 查看训练集样本、训练集样本标签、测试集样本、测试集样本标签的  大小
# print("训练集样本大小:",x_train.shape)
# print("训练集样本标签大小",y_train.shape)
# print("测试集样本大小:",x_test.shape)
# print("测试集样本大小:",y_test.shape)

# 决策树模型参数:criterion、splitter、max_depth、min_impurity_decrease、min_samples_split、
# min_samples_leaf、max_leaf_nodes、min_impurity_split、min_weight_fraction_leaf、class_weight
clf = tree.DecisionTreeClassifier(criterion="entropy")# 构造决策树
clf.fit(x_train,y_train)# 训练模型

# # 计算准确率
# y_predict = clf.predict(x_test)
# print(y_predict)
# accuracy = sum(y_predict == y_test)/y_test.shape[0]
# print('The accuracy is',accuracy)

score = clf.score(x_test,y_test)# 评价模型
print("\nThe accuracy is",score)
9、可视化决策树
# 可视化决策树
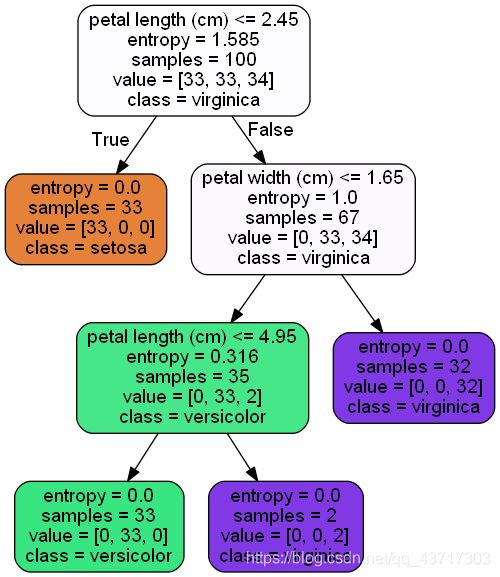
feature_names = iris.feature_names
target_names  = iris.target_names

clf_dot = tree.export_graphviz(clf,out_file = None,
                               feature_names = feature_names,
                               class_names = target_names,
                               filled = True,rounded = True)

graph = graphviz.Source(clf_dot, filename= "iris_decisionTree.gv",format= "png")
graph.view()
10、显示特征重要程度
# 显示特征重要程度
print("特征重要程度为:")
info = [*zip(feature_names, clf.feature_importances_)]
for cell in info:
    print(cell)
11、组合代码
#!/usr/bin/env python
# coding: utf-8

# In[104]:


import graphviz
import numpy as np
import pandas as pd
import matplotlib.pyplot as plt
from sklearn import tree
from sklearn.datasets import load_iris
from sklearn.tree import export_graphviz
from sklearn.model_selection import train_test_split


# In[105]:


iris = load_iris()# 载入鸢尾花数据集


# In[106]:


datas = iris.data# (150,4):150行5列
# print(datas)
# print(iris.target)


# In[107]:


x1 = [x[0] for x in datas]# 第1列:花萼长度 sepal_length
x2 = [x[1] for x in datas]# 第2列:花萼宽度 sepal_width
x3 = [x[2] for x in datas]# 第3列:花瓣长度 petal_length
x4 = [x[3] for x in datas]# 第4列:花瓣宽度 petal_width


# In[72]:


plt.scatter(x1[:50], x2[:50], color='red', marker='o', label='setosa') # 前50个样本
plt.scatter(x1[50:100],x2[50:100],color='blue',marker='x',label='vericolor')# 中间50个样本
plt.scatter(x1[100:150],x2[100:150],color='green',marker='+',label='Virginica')# 后50个样本
plt.legend(loc=1)# loc=1,2,3,4分别表示label在右上角,左上角,左下角,右下角
plt.show()


# In[108]:


# 单个直方图
# sepal_length 直方图
plt.hist(x1)
plt.xlabel("sepal_length")
plt.ylabel("sepal_length")
plt.show()
# sepal_width 直方图
plt.hist(x2)
plt.xlabel("sepal_width")
plt.ylabel("sepal_width")
plt.show()
# petal_length 直方图
plt.hist(x3)
plt.xlabel("petal_length")
plt.ylabel("petal_length")
plt.show()
# petal_width 直方图
plt.hist(x4)
plt.xlabel("petal_width")
plt.ylabel("petal_width")
plt.show()


# In[47]:


# 四合一
plt.hist(x1)
plt.hist(x2)
plt.hist(x3)
plt.hist(x4)
plt.show()


# In[76]:


# 单个散点图(其他的同理)
plt.scatter(x1,x2,color='blue',marker='o',label='sepal_length & sepal_width')
plt.scatter(x1,x3,color='red',marker='+',label='sepal_length & petal_length')
plt.scatter(x1,x4,color='green',marker='x',label='sepal_length & petal_width')
plt.legend(loc=2)
plt.show()


# In[77]:


# 直方图、散点图
irisdf = pd.DataFrame(datas,columns=['sepal_length','sepal_width','petal_length','petal_width'])
pd.plotting.scatter_matrix(irisdf,alpha = 0.5,
                           figsize =(10,8) ,grid = False,
                           diagonal = 'hist',marker = 'o',
                           range_padding = 0.01)
plt.show()


# In[122]:


x_true = iris.data
y_true = iris.target

# 一般划分比例:测试集约为1/3
x_train,x_test,y_train,y_test = train_test_split(x_true,y_true,test_size=0.33)

# 查看训练集样本、训练集样本标签、测试集样本、测试集样本标签的  大小
# print("训练集样本大小:",x_train.shape)
# print("训练集样本标签大小",y_train.shape)
# print("测试集样本大小:",x_test.shape)
# print("测试集样本大小:",y_test.shape)

# 决策树模型参数:criterion、splitter、max_depth、min_impurity_decrease、min_samples_split、
# min_samples_leaf、max_leaf_nodes、min_impurity_split、min_weight_fraction_leaf、class_weight
clf = tree.DecisionTreeClassifier(criterion="entropy")# 构造决策树
clf.fit(x_train,y_train)# 训练模型

# # 计算准确率
# y_predict = clf.predict(x_test)
# print(y_predict)
# accuracy = sum(y_predict == y_test)/y_test.shape[0]
# print('The accuracy is',accuracy)

score = clf.score(x_test,y_test)# 评价模型
print("\nThe accuracy is",score)


# In[126]:


# 可视化决策树
feature_names = iris.feature_names
target_names  = iris.target_names

clf_dot = tree.export_graphviz(clf,out_file = None,
                               feature_names = feature_names,
                               class_names = target_names,
                               filled = True,rounded = True)

graph = graphviz.Source(clf_dot, filename= "iris_decisionTree.gv",format= "png")
graph.view()


# In[127]:


# 显示特征重要程度
print("特征重要程度为:")
info = [*zip(feature_names, clf.feature_importances_)]
for cell in info:
    print(cell)


