Perceptron感知机代码讲解笔记
Perceptron感知机代码讲解笔记
核心代码讲解
import numpy as np
import pandas as pd
from sklearn.datasets import load_iris
#鸢尾花三分类问题
import matplotlib.pyplot as plt
iris=load_iris()
#this func return a dictionary
#print(iris)
print(type(iris.data),type(iris.feature_names))
df=pd.DataFrame(iris.data,columns=iris.feature_names)
#注意DF大写
df['label']=iris.target
#df最后加了一列‘label’
#df.columns=['sepal length','sepal width','petal length','petal width','label']
print(type(df.columns))
print(df.columns)
print()
print(df)
print()
df.label.value_counts()
# print()
# print(type(df.label.value_counts()))
# print()
Index(['sepal length', 'sepal width', 'petal length', 'petal width', 'label'], dtype='object')

     sepal length  sepal width  petal length  petal width  label
0             5.1          3.5           1.4          0.2      0
1             4.9          3.0           1.4          0.2      0
2             4.7          3.2           1.3          0.2      0
3             4.6          3.1           1.5          0.2      0
4             5.0          3.6           1.4          0.2      0
..            ...          ...           ...          ...    ...
145           6.7          3.0           5.2          2.3      2
146           6.3          2.5           5.0          1.9      2
147           6.5          3.0           5.2          2.0      2
148           6.2          3.4           5.4          2.3      2
149           5.9          3.0           5.1          1.8      2

(df.label.value_counts()的输出):
[150 rows x 5 columns]
2    50
1    50
0    50
Name: label, dtype: int64
-
iris本身是一个字典
-
dataframe添加一列 访问dataframe两种方式:
1.df[0]
2.df[‘sepal length’] -
dataframe可以指定列名(columns=…)和行名(index=…),否则默认从0起标号。
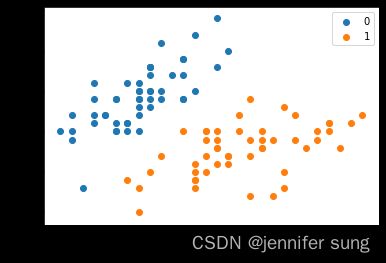
plt.scatter(df[:50]['sepal length'],df[:50]['sepal width'],label='0')
plt.scatter(df[50:100]['sepal length'],df[50:100]['sepal width'],label='1')
plt.xlabel('sepal length')
plt.ylabel('sepal width')
plt.legend()#显示右上角的图例
data=np.array(df.iloc[:100,[0,1,-1]])
X,y=data[:,:-1],data[:,-1]
#[1:2] 左闭右开
#data[:,:-1]所有行,一直到倒数第一列(不包含最后一列)
y=np.array([1 if i==1 else -1 for i in y])
#生成式,前50个元素设为1,后50个元素的类别设为-1
- .
注意!!!y=np.array([1 if i==1 else -1 for i in y])必须要有[ ]!!!!
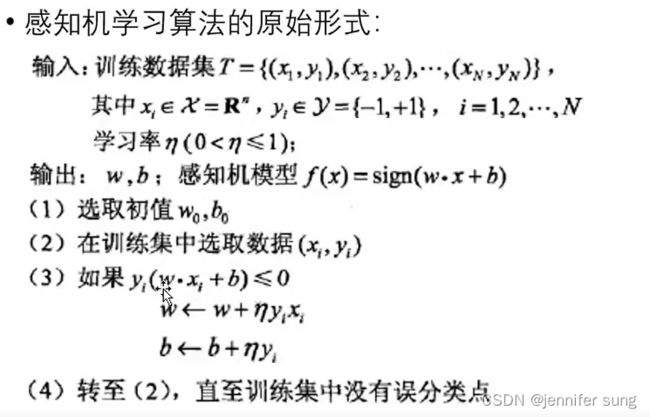
class Model:
    def __init__(self):
        self.w=np.ones(len(data[0])-1,dtype=np.float32)
        #此处len(data[0]-1)=2
        self.b=0
        self.l_rate=0.1

        #self.data=data
    def sign(self,x,w,b):
        y=np.dot(x,w)+b
        return y
    #返回的y的取值为负无穷到正无穷
    #sign是检验函数,y*sign()<=0意味着分错了,此时我们需要继续更新w,b值

    #随机梯度下降法
    # 它适用于所有机器学习方法;牛顿法则不是
    #一次只更新一个样本
    #批梯度下降法
    #输出一个恰当的w,b
    def fit(self,X_train,y_train):
        #X_train一百行两列
        is_wrong=False#标记变量??
        while not is_wrong:
            wrong_count=0#计数器
            for d in range(len(X_train)):# [[0.1,0.2][0.2,0.3]......]
                                        # len(data):一共的行数
                                        #d遍历0-99
                X=X_train[d]
                y=y_train[d]
                #分错了,要更新w,b值
                if y*self.sign(X,self.w,self.b)<=0:
                    self.w=self.w+self.l_rate*np.dot(y,X)
                    self.b=self.b+self.l_rate*y
                    wrong_count+=1
                #没有分错!
            if wrong_count==0:
                is_wrong=True
        return 'Perception Model1'

    def score(self):
        pass
perceptron=Model()
perceptron.fit(X,y)
'Perception Model1'
#可视化
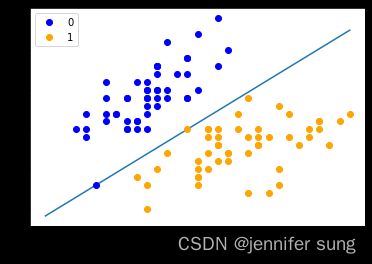
#以下画出这个分界线
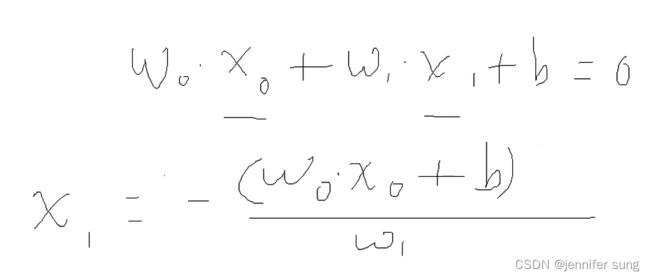
#w0*xo+w1*x1+b=0-->x1=-(w0*x0+b)/w1
x_points=np.linspace(4,7,10)
#print(x_points)
#linspace(4,7,10)4-10生成10个等间隔点
y_=-(perceptron.w[0]*x_points+perceptron.b)/perceptron.w[1]
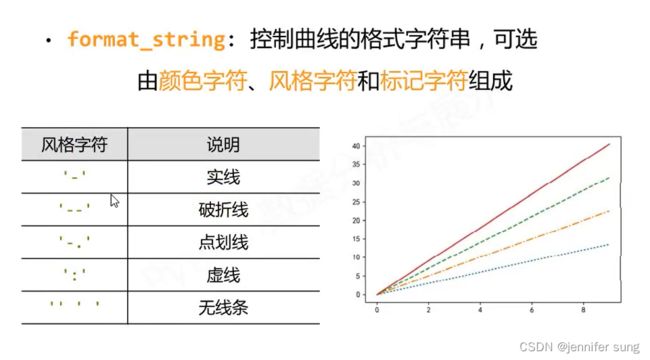
plt.plot(x_points,y_)

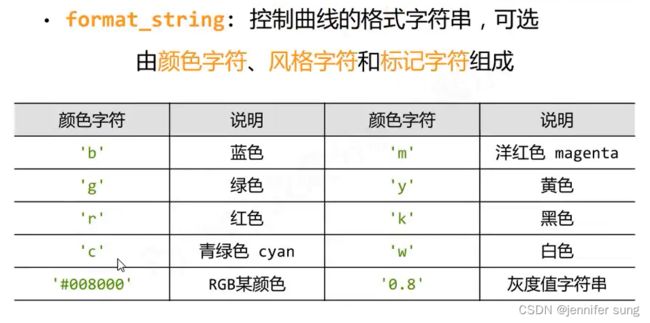
plt.plot(data[:50,0],data[:50,1],'bo',color='blue',label='0')
plt.plot(data[50:100,0],data[50:100,1],'bo',color='orange',label='1')
plt.xlabel('sepal length')
plt.xlabel('sepal width')
plt.legend()
df.label.value_counts():
- 作用:查看表格某列中有多少个不同值,
- 例子
data=pd.DataFrame({'字段1':[1,2,3,4,5,6,5,3],
                   '字段2':['A','B','C','C','D','D','E','A']})
print(data)
print(data.dtypes)
 字段1 字段2
0    1   A
1    2   B
2    3   C
3    4   C
4    5   D
5    6   D
6    5   E
7    3   A
字段1     int64
字段2    object
dtype: object
data['字段1'].value_counts()
5    2
3    2
6    1
4    1
2    1
1    1
Name: 字段1, dtype: int64
data['字段2'].value_counts()
C    2
D    2
A    2
B    1
E    1
Name: 字段2, dtype: int64
- 可以看出,value_counts()对连续变量和分类变量都适用
- 默认降序
- 升序:
python data['字段2'].value_counts(ascending=True)
E    1
B    1
A    2
D    2
C    2
Name: 字段2, dtype: int64
- 想看占比,可以设置normalize=True
- data['字段2'].value_counts(normalize=True)
C    0.250
D    0.250
A    0.250
B    0.125
E    0.125
Name: 字段2, dtype: float64
- dataframe.apply可以统计所有列中的值出现的次数
-data=pd.DataFrame({'区域1':[1,2,3,4,3,2,1],'区域2':[1,1,2,3,5,3,1]}) print(data.apply(pd.value_counts))
区域1  区域2
1  2.0  3.0
2  2.0  1.0
3  2.0  2.0
4  1.0  NaN
5  NaN  1.0
loc方法&iloc方法
-
loc通过 标签(index) 在dataframe中选取数据
-
iloc通过 位置(默认行号,就是从0起) 在dataframe中选取数据
df1=pd.DataFrame({'AAA':[120,101,106],
                  'BBB':[223,112,230],
                  'CCC':[124,156,145],
                  'DDD':'ABCDEFG'},index=[1,2,3])
print(df1)
#获取一行数据
print()
print(df1.loc[1])
print()
#获取多行数据
print(df1.loc[[1,3]])
print()
print(df1.iloc[1])
AAA  BBB  CCC      DDD
1  120  223  124  ABCDEFG
2  101  112  156  ABCDEFG
3  106  230  145  ABCDEFG

AAA        120
BBB        223
CCC        124
DDD    ABCDEFG
Name: 1, dtype: object

   AAA  BBB  CCC      DDD
1  120  223  124  ABCDEFG
3  106  230  145  ABCDEFG

AAA        101
BBB        112
CCC        156
DDD    ABCDEFG
Name: 2, dtype: object
plt.plot
plt.plot(x,y,format_string,
			color,linestyle,
			maker,
			markerfacecolor......)
