Python (三): PIL.Image基本图像处理
Python 三: 图像处理
- 需要 Import 的库
- 基本操作
- 新建, 裁剪, 缩放和粘贴
- 旋转和翻转
- 滤镜
- 通道分离, 像素操作
需要 Import 的库
from PIL import Image
import numpy as np
import matplotlib.pyplot as plot
以下所有代码都引用了上述三行代码
基本操作
# 读取图片
img = Image.open("./demo.jpg")

# 获取图片的尺寸
print(img.size)
# > (32, 32)

# 转化为灰度图
grayscale = img.convert('L')
# 转化为二值图
binary = img.convert('1')

# 显示图片
plot.subplot(1, 3, 1)
plot.imshow(img)
plot.subplot(1, 3, 2)
plot.imshow(grayscale)
plot.subplot(1, 3, 3)
plot.imshow(binary)
plot.show()

# np 数组 之间的互相转换
img_array = np.array(img)
img_img = Image.fromarray(img_array)

# 保存图片
binary.save('./binary.png')
新建, 裁剪, 缩放和粘贴
im1 = Image.open("./demo.jpg") # im1 大小为 32 * 32

# 新建一个 64 * 64 的灰度图, 默认填充 0
im2 = Image.new('L', (64, 64), 0)

# 在 im2 左上角粘贴 im1
im2.paste(im1, (0, 0))

# 在 im2 右上方粘贴 im2 的 (0,0) 到 (30, 30) 部分的图片
im2.paste(im1.crop((0, 0, 30, 30)).resize((32, 32)), (32, 0))
# 同上
im2.paste(im1.crop((0, 0, 25, 25)).resize((32, 32)), (0, 32))
# 同上
im2.paste(im1.crop((0, 0, 18, 18)).resize((32, 32)), (32, 32))
plot.imshow(im2)
plot.show()
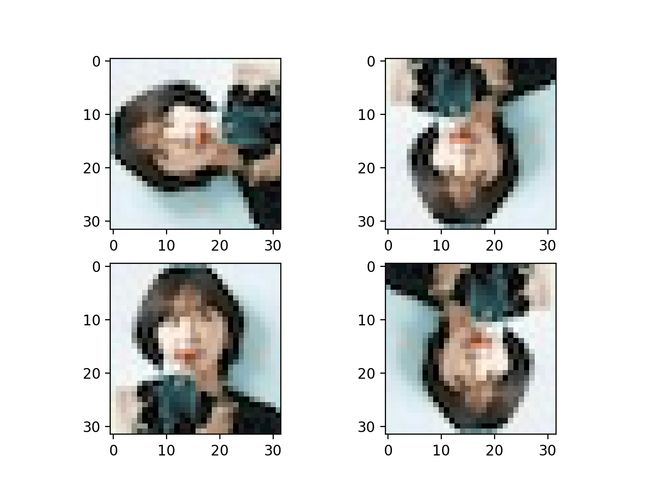
旋转和翻转
im = Image.open("./demo.jpg")

# 旋转
plot.subplot(2, 2, 1)
plot.imshow(im1.rotate(90))

plot.subplot(2, 2, 2)
plot.imshow(im1.rotate(180))

# 翻转
plot.subplot(2, 2, 3)
plot.imshow(im1.transpose(Image.FLIP_LEFT_RIGHT))
plot.subplot(2, 2, 4)
plot.imshow(im1.transpose(Image.FLIP_TOP_BOTTOM))

plot.show()
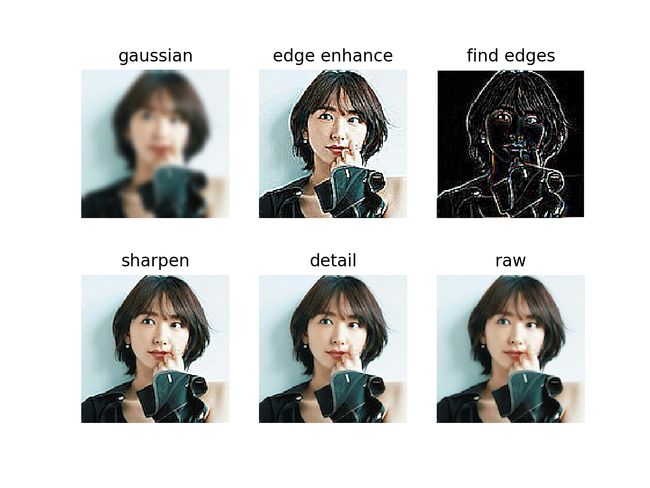
滤镜
from PIL import ImageFilter
im = Image.open("./aragaki_yui.jpg")

plot.subplot(2, 3, 1)
plot.axis('off')
plot.title('gaussian')
plot.imshow(im.filter(ImageFilter.GaussianBlur))

plot.subplot(2, 3, 2)
plot.axis('off')
plot.title('edge enhance')
plot.imshow(im.filter(ImageFilter.EDGE_ENHANCE))

plot.subplot(2, 3, 3)
plot.axis('off')
plot.title('find edges')
plot.imshow(im.filter(ImageFilter.FIND_EDGES))

plot.subplot(2, 3, 4)
plot.axis('off')
plot.title('sharpen')
plot.imshow(im.filter(ImageFilter.SHARPEN))

plot.subplot(2, 3, 5)
plot.axis('off')
plot.title('detail')
plot.imshow(im.filter(ImageFilter.DETAIL))

plot.subplot(2, 3, 6)
plot.axis('off')
plot.title('raw')
plot.imshow(im)
plot.show()
通道分离, 像素操作
im = Image.open("./aragaki_yui.jpg")

# 通道分离
rgb = im.split()
R, G, B = 0, 1, 2

# 使用 lambda 表达式实现像素级操作
rgb[R].paste(rgb[R].point(lambda x : x * 0.9))
rgb[G].paste(rgb[G].point(lambda x : x * 0.9))
rgb[B].paste(rgb[B].point(lambda x : x * 0.75))

plot.subplot(1, 2, 1)
plot.imshow(im)
plot.subplot(1, 2, 2)
plot.imshow(Image.merge(im.mode, rgb))
plot.show()


