如何在 Python 中创建用于分类的模拟数据?
在本文中,我们将看到如何在 Python 中创建用于分类的模拟数据。
我们将使用 sklearn 库,它为模拟分类数据提供了各种生成器。
单一标签分类
这里我们将看到单标签分类,为此我们将使用一些可视化技术。
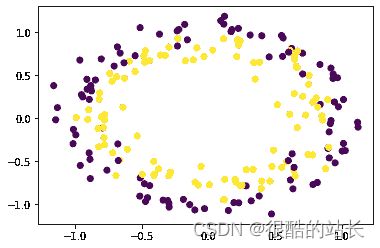
示例 1:使用 make_circles()
make_circles 生成具有球形决策边界的二维二进制分类数据。
Python 3
from sklearn.datasets import make_circles
import pandas as pd
import matplotlib.pyplot as plt

X, y = make_circles(n_samples=200, shuffle=True,
                    noise=0.1, random_state=42)
plt.scatter(X[:, 0], X[:, 1], c=y)
plt.show()
输出:
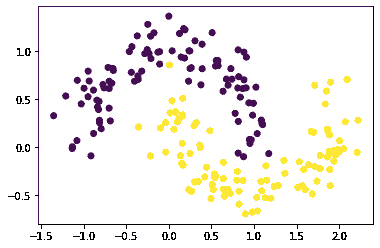
示例 2:使用 make_moons()
make_moons() 生成两个交错半圆形状的 2d 二进制分类数据。
Python 3
from sklearn.datasets import make_moons
import pandas as pd
import matplotlib.pyplot as plt

X, y = make_moons(n_samples=200, shuffle=True,
                  noise=0.15, random_state=42)
plt.scatter(X[:, 0], X[:, 1], c=y)
plt.show()
输出:
例 3。使用 make_blobs()
make_blobs() 以 blob 的形式生成可用于聚类的数据
Python 3
from sklearn.datasets import make_blobs
import pandas as pd
import matplotlib.pyplot as plt

X, y = make_blobs(n_samples=200, n_features=2, centers=3,
                  shuffle=True, random_state=42)
plt.scatter(X[:, 0], X[:, 1], c=y)
plt.show()
输出:
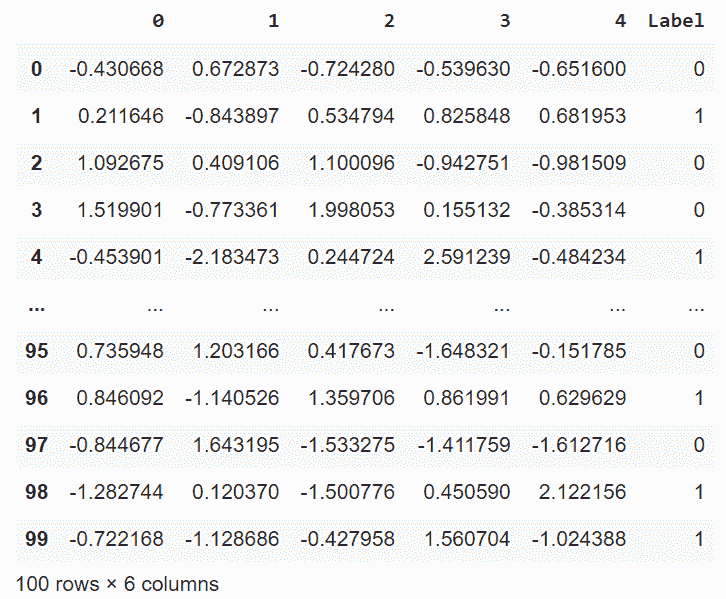
例 4。使用make _ classing()
make_classification() 生成随机 n 类分类问题
Python 3
from sklearn.datasets import make_classification
import pandas as pd
import matplotlib.pyplot as plt

X, y = make_classification(n_samples=100, n_features=5,
                           n_classes=2,
                           n_informative=2, n_redundant=2,
                           n_repeated=0,
                           shuffle=True, random_state=42)
pd.concat([pd.DataFrame(X), pd.DataFrame(
    y, columns=['Label'])], axis=1)
输出:
多标签分类
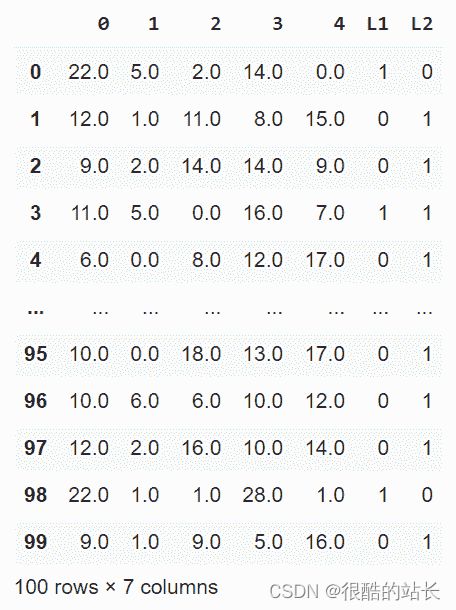
make _ multi label _ classification()生成随机多标签分类问题。
Python 3
from sklearn.datasets import make_multilabel_classification
import pandas as pd
import matplotlib.pyplot as plt

X, y = make_multilabel_classification(n_samples=100, n_features=5,
                                      n_classes=2, n_labels=1,
                                      allow_unlabeled=False,
                                      random_state=42)
pd.concat([pd.DataFrame(X), pd.DataFrame(y,
                                         columns=['L1', 'L2'])],
          axis=1)
输出:


