【MATLAB100个实用小技巧】——图形应用(21-32)
文章目录
- 前言
- 系列文章
-
- 21. PEAKS 函数曲线
- 22. 片状图
- 23. 视角的调整
- 24. 向量场的绘制
- 25. 灯光定位
- 26. 柱状图
- 27. 设置照明方式
- 28. 羽状图
- 29. 立体透视(1)
- 30. 立体透视(2)
- 31. 表面图形
- 32. 沿曲线移动的小球
前言
MATLAB是一个功能强大的软件,我们可以利用MATLAB进行绘图、算法验证、仿真实验等等。在学习MATLAB的过程中,繁多的命令与代码往往容易使我们脑容量过载
本系列将总结一些常见的MATLAB编程小技巧
可能有些地方会有些错误或者是不太完善的,还请大家在评论区直接指出❤️❤️❤️
系列文章
【MATLAB100个实用小技巧】——图形应用(1-10)
【MATLAB100个实用小技巧】——图形应用(11-20)
【MATLAB100个实用小技巧】——图形应用(21-32)
【MATLAB100个实用小技巧】——界面设计(33-43)
【MATLAB100个实用小技巧】——界面设计(44-55)
【MATLAB100个实用小技巧】——界面设计(56-66)
【MATLAB100个实用小技巧】——图形处理(67-75)
【MATLAB100个实用小技巧】——图形处理(76-84)
【MATLAB100个实用小技巧】——数值分析(85-100)
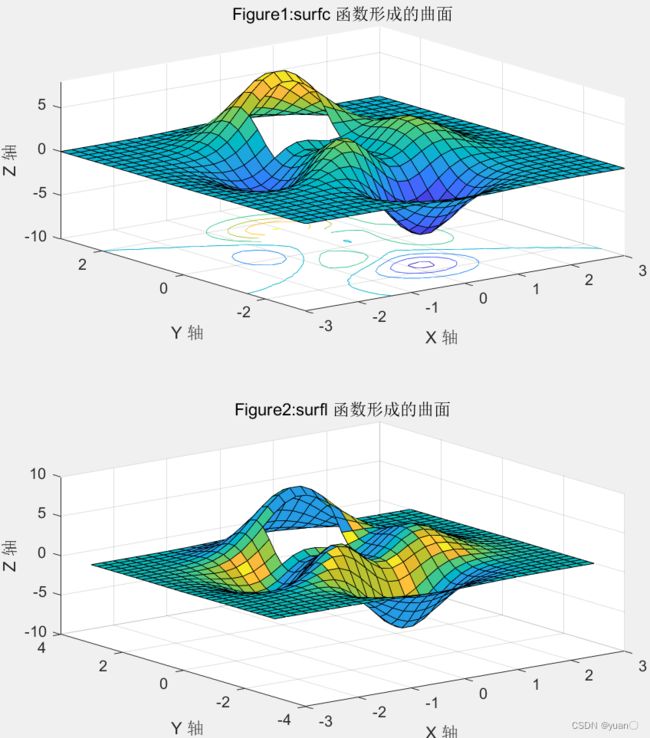
21. PEAKS 函数曲线
重点 peaks surfc surfl←此处有链接
代码
function Curve_sin_and_cos
h0 = figure('ToolBar','none','Position',[150 250 500 400],'name','Curve of sinandcos()');
[x,y,z]=peaks(30);
subplot(2,1,1);
x=x(1,:);
y=y(:,1);
i=find(y>0.8&y<1.2);
j=find(x>-0.6&x<0.5);
z(i,j)=nan*z(i,j);
surfc(x,y,z)
xlabel('X 轴');
ylabel('Y 轴');
zlabel('Z 轴');
title('Figure1:surfc 函数形成的曲面')

subplot(2,1,2);
x=x(1,:);
y=y(:,1);
i=find(y>0.8&y<1.2);
j=find(x>-0.6&x<0.5);
z(i,j)=nan*z(i,j);
surfl(x,y,z)
xlabel('X 轴');
ylabel('Y 轴');
zlabel('Z 轴');
title('Figure2:surfl 函数形成的曲面')
22. 片状图
重点delaunay trisurf trimesh←此处有链接
代码
function Curve_sin_and_cos
h0 = figure('ToolBar','none','Position',[150 250 500 400],'name','Curve of sinandcos()');
subplot(1,2,1);
x=rand(1,20);
y=rand(1,20);
z=peaks(x,y*pi);
t=delaunay(x,y);
trimesh(t,x,y,z) ;
hidden off;
title('Figure1:Triangular Surface Plot');


subplot(1,2,2);
x=rand(1,20);
y=rand(1,20);
z=peaks(x,y*pi);
t=delaunay(x,y);
trisurf(t,x,y,z);
title('Figure1:Triangular Surface Plot');
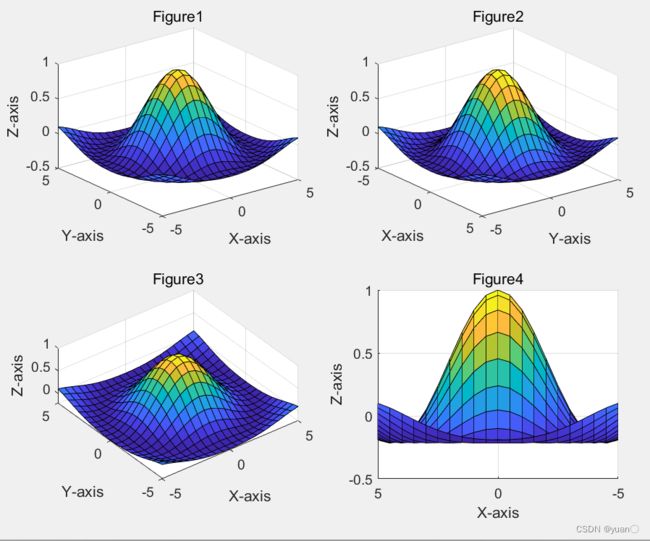
23. 视角的调整
重点 view←此处有链接
代码
function Curve_sin_and_cos
h0 = figure('ToolBar','none','Position',[150 250 500 400],'name','Curve of sinandcos()');
x=-5:0.5:5;
[x,y]=meshgrid(x);
r=sqrt(x.^2+y.^2)+eps; z=sin(r)./r;
subplot(2,2,1);
surf(x,y,z);
xlabel('X-axis');
ylabel('Y-axis');
zlabel('Z-axis');
title('Figure1') ;
view(-37.5,30);

subplot(2,2,2) ;
surf(x,y,z);
xlabel('X-axis');
ylabel('Y-axis');
zlabel('Z-axis') ;
title('Figure2') ;
view(-37.5+90,30);

subplot(2,2,3);
surf(x,y,z);
xlabel('X-axis');
ylabel('Y-axis');
zlabel('Z-axis');
title('Figure3');
view(-37.5,60);

subplot(2,2,4);
surf(x,y,z);

xlabel('X-axis');
ylabel('Y-axis');
zlabel('Z-axis');
title('Figure4');
view(180,0);
24. 向量场的绘制
重点 ribbon quiver quiver3←此处有链接
代码
function Curve_sin_and_cos
h0 = figure('ToolBar','none','Position',[150 250 500 400],'name','Curve of sinandcos()');
subplot(2,2,1);
z=peaks;
ribbon(z);
title('Figure1');

subplot(2,2,2);
[x,y,z]=peaks(15);
[dx,dy]=gradient(z,0.5,0.5);
contour(x,y,z,10);
hold on ;
quiver(x,y,dx,dy);
hold off;
title('Figure2');

subplot(2,2,3);
[x,y,z]=peaks(15);
[nx,ny,nz]=surfnorm(x,y,z);
surf(x,y,z);
hold on ;
quiver3(x,y,z,nx,ny,nz);
hold off;
title('Figure3');

subplot(2,2,4);
x=rand(3,5);
y=rand(3,5);
z=rand(3,5);
c=rand(3,5);
fill3(x,y,z,c);
grid on ;
title('Figure4');
25. 灯光定位
重点 material shiny light←此处有链接
代码
function Curve_sin_and_cos
h0 = figure('ToolBar','none','Position',[150 250 500 400],'name','Curve of sinandcos()');
vert=[1 1 1;1 2 1;
     2 2 1;2 1 1;
     1 1 2;1 2 2;
     2 2 2;2 1 2];
fac=[1 2 3 4;2 6 7 3;
     4 3 7 8;1 5 8 4;
     1 2 6 5;5 6 7 8];
grid off;
sphere(36);
h=findobj('type','surface');
set(h,'facelighting','phong','facecolor','interp','edgecolor',[0.4 0.4 0.4], 'backfacelighting','lit') ;
hold on;
patch('faces',fac,'vertices',vert, 'facecolor','y');
light('position',[1 3 2]);
light('position',[-3 -1 3]);
material shiny;
axis vis3d off;
hold off;
26. 柱状图
重点 bar barh←此处有链接
代码
function Curve_sin_and_cos
h0 = figure('ToolBar','none','Position',[150 250 500 400],'name','Curve of sinandcos()');
subplot(2,1,1)
x=[5 2 1
    8 7 3
    9 8 6
    5 5 5
    4 3 2];
bar(x);
xlabel('X 轴');
ylabel('Y 轴');
title('第一子图');

subplot(2,1,2);
y=[5 2 1
    8 7 3
    9 8 6
    5 5 5
    4 3 2];
barh(y);
xlabel('X 轴');
ylabel('Y 轴');
title('第二子图');
27. 设置照明方式
重点 sphere camlight shading←此处有链接
代码
function Curve_sin_and_cos
h0 = figure('ToolBar','none','Position',[150 250 500 400],'name','Curve of sinandcos()');
subplot(2,2,1);
sphere; shading flat;
camlight left;
camlight right;
lighting flat;
colorbar;
axis off;
title('Figure1');

subplot(2,2,2);
sphere;
shading flat;
camlight left;
camlight right;
lighting gouraud;
colorbar;
axis off;
title('Figure2');

subplot(2,2,3);
sphere;
shading interp;
camlight right;
camlight left;
lighting phong;
colorbar;
axis off;
title('Figure3');

subplot(2,2,4);
sphere;
shading flat;
camlight left;
camlight right;
lighting none;
colorbar;
axis off;
title('Figure4')
28. 羽状图
重点 feather←此处有链接
代码
function Curve_sin_and_cos
h0 = figure('ToolBar','none','Position',[150 250 500 400],'name','Curve of sinandcos()');
subplot(2,1,1);
alpha=90:-10:0;
r=ones(size(alpha));
m=alpha*pi/180;
n=r*10;
[u,v]=pol2cart(m,n);
feather(u,v);
title('羽状图');
axis([0 20 0 10]);

subplot(2,1,2);
t=0:0.5:10;
x=0.05+i;
y=exp(-x*t);
feather(y);
title('复数矩阵的羽状图');
29. 立体透视(1)
重点 slice←此处有链接
代码
function Curve_sin_and_cos
h0 = figure('ToolBar','none','Position',[150 250 500 400],'name','Curve of sinandcos()');
[x,y,z]=meshgrid(-2:0.1:2,...
-2:0.1:2,...
-2:0.1:2);
v=x.*exp(-x.^2-y.^2-z.^2);
grid on;
for i=-2:0.5:2;
    h1=surf(linspace(-2,2,20),linspace(-2,2,20),zeros(20)+i);
    rotate(h1,[1 -1 1],30);
    dx=get(h1,'xdata');
    dy=get(h1,'ydata');
    dz=get(h1,'zdata');
    delete(h1);
    slice(x,y,z,v,[-2 2],2,-2) ;
    hold on;
    slice(x,y,z,v,dx,dy,dz);
    hold off;
    axis tight;
    view(-5,10);
    drawnow;
end
效果
30. 立体透视(2)
重点 xlim←此处有链接
代码
function Curve_sin_and_cos
h0 = figure('ToolBar','none','Position',[150 250 500 400],'name','Curve of sinandcos()');
[x,y,z]=meshgrid(-2:0.1:2,...
-2:0.1:2,...
-2:0.1:2);
v=x.*exp(-x.^2-y.^2-z.^2);
[dx,dy,dz]=cylinder;
slice(x,y,z,v,[-2 2],2,-2);
for i=-2:0.2:2
    h=surface(dx+i,dy,dz);
    rotate(h,[1 0 0],90);
    xp=get(h,'xdata');
    yp=get(h,'ydata');
    zp=get(h,'zdata');
    delete(h);
    hold on;
    hs=slice(x,y,z,v,xp,yp,zp);
    axis tight;
    xlim([-3 3]);
    view(-10,35);
    drawnow;
    delete(hs);
    hold off;
end
效果
31. 表面图形
重点 griddata hadamard←此处有链接
代码
function Curve_sin_and_cos
h0 = figure('ToolBar','none','Position',[150 250 500 400],'name','Curve of sinandcos()');
subplot(1,2,1);
x=rand(100,1)*16-8; y=rand(100,1)*16-8;
r=sqrt(x.^2+y.^2)+eps;
z=sin(r)./r; xlin=linspace(min(x),max(x),33);
ylin=linspace(min(y),max(y),33);
[X,Y]=meshgrid(xlin,ylin);
Z=griddata(x,y,z,X,Y,'cubic');
mesh(X,Y,Z);
axis tight;
hold on;
plot3(x,y,z,'.','Markersize',20);

subplot(1,2,2);
k=5;
n=2^k-1;
theta=pi*(-n:2:n)/n;
phi=(pi/2)*(-n:2:n)'/n;
X=cos(phi)*cos(theta);
Y=cos(phi)*sin(theta);
Z=sin(phi)*ones(size(theta));
colormap([0 0 0;1 1 1]);
C=hadamard(2^k);
surf(X,Y,Z,C);
axis square;
32. 沿曲线移动的小球
参考博客 https://www.jianshu.com/p/1a1d5d775dd9
重点
1。画出螺旋线背景
2.改变小球的位置,不断刷新图像,看起来就是动画了
代码
function f = ballw( K,ki )
%ballw.m演示红色小球沿着一条封闭螺旋线运动的实时动画
%仅演示实时动画的调试格式为ballw(K)
%既演示实时动画又拍摄照片的调试格式为f = ballw(K,ki)
%K红球运动的循环次数(不小于1)
%ki指定拍摄照片的瞬间,取1到1034之间的任意整数
%f存储拍摄的照片数据,可用image(f.cdata)观察照片
%产生封闭的运动轨迹

t1 = (0:1000)/1000 * 10 * pi;
x1 = cos(t1);
y1 = sin(t1);
z1 = -t1;

t2 = (0:10)/10;
x2 = x1(end) * (1-t2);
y2 = y1(end) * (1-t2);
z2 = z1(end) * ones(size(x2));

t3 = t2;
z3 = (1-t3)* z1(end);
x3 = zeros(size(z3));
y3 = x3;

t4 = t2;
x4 = t4;
y4 = zeros(size(x4));
z4 = y4;

x = [x1 x2 x3 x4];
y = [y1 y2 y3 y4];
z = [z1 z2 z3 z4];
%data = [x',y',z']              %查看封闭曲线的坐标数值
plot3(x,y,z,'r','Linewidth',4)  %绘制曲线
axis off;                       %不画坐标轴
%定义“线”色、“点”型(点)、点的大小(40)、擦除方式(xor)
h = line('Color',[0.67 0 1],'Marker','.','MarkerSize',40,'EraseMode','xor');
%使小球运动
n = length(x);
i = 1;
j = 1;
while 1
    set(h,'xdata',x(i),'ydata',y(i),'zdata',z(i));
    %bw = [x(i),y(i),z(i)]     %查看小球位置
    drawnow;                    %刷新屏幕
    pause(0.01)               %控制球速
    i = i+1;
    if nargin == 2 && nargout == 1  %当输入变量个数为2并且输出变量1个时才拍摄照片
        if (i == ki && j == 1)
            f = getframe(gcf);      %拍摄i = ki时的照片
        end
    end
    if i > n
        i = 1;
        j = j+1;
        if j > K
            break;
        end
    end
end


