用Python打造无人驾驶车-激光雷达数据(1)
ROS环境安装ROS/Tutorials - ROS Wiki
ROS数据包Udacity Didi Challenge - Round 2 Dataset
前言:
激光雷达是无人驾驶车的一个重要数据源,同时也是最难处理的数据之一。相对于图像数据而言,激光雷达有着更可靠的深度数据。特斯拉的辅助驾驶系统曾因为过度依赖图像数据产生的误判而造成严重的事故,而有了激光雷达之后,就可以避免因为图像造成的误判。本文将介绍如何初步的处理激光雷达生成的点云数据。
数据可视化
在处理数据之前,让我们先来看看原始数据什么样。使用ROS自带的rviz可以很轻松的查看各种数据。
可以看出,激光雷达的点云是环状的,这是因为一个激光雷达由多个线构成,每个线都在不停的旋转扫描,获取返回的数据,本文使用的数据包中,激光雷达数据来自与一个velodyne 32线雷达。从可视化的图中,可以看出点云采样展示了周边的物体和地形情况。
聚类数据(=>识别点云中的物体)
为了能够让机器学习的算法识别点云中的物体,我们先要进行一些预处理,将点云数据进行聚类,区分不同的物体。
读取数据:
import os
import rosbag
import numpy as np
import sensor_msgs.point_cloud2 as pc2

# car 本文主要介绍如何分离出物体,故在读取数据时先将地面和天空中的物体去除,以简化聚类。
zmin=-1.0
zmax=0.2

files = os.listdir(bag_file_dir)

pointclouds = []

bag = rosbag.Bag(os.path.join(bag_file_dir, 'pointcloud.bag'))

for topic, msg, t in bag.read_messages(
    topics = [
        '/velodyne_points'
    ]):
    lidar = pc2.read_points(msg)
    points = np.array(list(lidar))
    points = points[np.where([zmin <= point[2] <= zmax for point in points])]

pointclouds.append(points)由于无人车本体是已知的数据,所以可以在点云中首先过滤掉,减少之后处理的数据量。
car_x_max = 3.8-1.5494
car_x_min = -1.5494-0.8128
car_y_max = 1.5748/2
car_y_min = -1.5748/2
def remove_self(pointcloud):
    return pointcloud[
        np.where(
            [np.logical_not(car_x_min <= point[0] <= car_x_max and car_y_min <= point[1] <= car_y_max) for point in pointcloud]
        )
    ]
接下来就只剩下需要聚类的数据了。
聚类数据使用简化的K-D-Tree算法。简单的说,就是选一个点,然后聚类在这个点附近一定范围内的点,以此递归,直到一定范围内没有点为止,再聚类下一个物体。同时,我们知道道路上的物体一般都是在地面上的,一般不会悬浮在空中,所以这里只需要对xy轴数据进行处理就好了。
def cluster(points, radius=0.2):
    """
    points: pointcloud
    radius: max cluster range
    """
    items = []
    while len(points)>1:
        item = np.array([points[0]])
        base = points[0]
        points = np.delete(points, 0, 0)
        distance = (points[:,0]-base[0])**2+(points[:,1]-base[1])**2
        infected_points = np.where(distance <= radius**2)
        item = np.append(item, points[infected_points], axis=0)
        border_points = points[infected_points]
        points = np.delete(points, infected_points, 0)
        while len(border_points) > 0:
            border_base = border_points[0]
            border_points = np.delete(border_points, 0, 0)
            border_distance = (points[:,0]-border_base[0])**2+(points[:,1]-border_base[1])**2
            border_infected_points = np.where(border_distance <= radius**2)
            item = np.append(item, points[border_infected_points], axis=0)
            border_points = points[border_infected_points]
            points = np.delete(points, border_infected_points, 0)
        items.append(item)
    return items
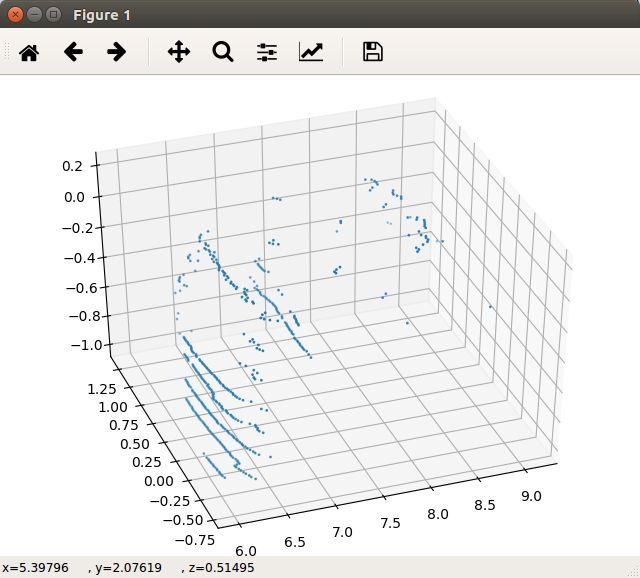
处理过后,可以matplotlib查看聚类出来的数据,如果你使用jupyter notebook建议使用%matplotlib的方式,这样可以在新窗口用鼠标动态三维的查看数据。
import matplotlib
import matplotlib.pyplot as plt
from mpl_toolkits.mplot3d import Axes3D
%matplotlib

fig = plt.figure()
ax = Axes3D(fig)
fig = plt.figure()
ax = Axes3D(fig)
ax.scatter(item[:,0], item[:,1], item[:,2], s=1)
fig.show()
看出来这是一辆车了吗?激光雷达只能探测到靠近自身的一侧,所以这是一辆车的后部,也就是在自身的前方的车。
一点思考
1.现在的地面数据处理方法有什么弊端?
2.对地面数据有没有更好的处理方法?
3.聚类最佳参数是多少?
4.如何过滤无用的障碍物?
5.激光雷达产生点云除了有xyz数据,还有强度和线圈数据,有什么用处吗?
相关论文参考
[2016] Lidar-based Methods for Tracking and Identification [ref][youtube]

