机器学习逐渐放弃:线性回归,逻辑回归
浑浑噩噩的混了一个月,,也不知道学了啥,就看看吴老师的视频吧。。
下面的是人家(黄老师。。)整理的作业答案吧。。写写注释,,就当作笔记了。。。
线性回归
区分一下 /* @ .dot np.mutiply:
*: 根据数据类型的不同,可能是做点乘运算,也可能做矩阵乘法运算
@: 只做矩阵乘法运算
.dot: 只做矩阵乘法运算
np.mutiply:只做点乘运算
J ( θ ) = 1 2 m ∑ i = 1 m ( h θ ( x ( i ) ) − y ( i ) ) 2 J\left( \theta \right)=\frac{1}{2m}\sum\limits_{i=1}^{m}{{{\left( {{h}_{\theta }}\left( {{x}^{(i)}} \right)-{{y}^{(i)}} \right)}^{2}}} J(θ)=2m1i=1∑m(hθ(x(i))−y(i))2
import numpy as np
import pandas as pd
import matplotlib.pyplot as plt

# 初始化数据的三个函数,,,这里只是为了省事。。还要根据实际的数据形式读取特征啊之类的。。
def get_X(df): # 读取特征
    df.insert(0,'ones',1)   # 插入一列 1
    cols = df.shape[1]
    X = df.iloc[:,0:cols-1]
    return np.array(X.values)      # 返回数组

def get_y(df): # 读取标签
    cols = df.shape[1]
    y = data.iloc[:,cols-1:cols]
    return np.array(y.values)     # 反正就是适应格式。。。

def normalize_feature(df): # 归一化
    return df.apply(lambda column: (column - column.mean()) / column.std()))

# 计算的函数
def computercost(X, y, theta):     # 代价函数
    inner = np.power(((X @ theta.T) - y ),2)  # X m*n  theta n*1
    return np.sum(inner) / (2 * len(X))

def cost2(theta,X,y):   # 另一个版本
    m=X.shape[0]
    error = X @ theta - y
    square_sum = error.T @ error
    cost = square_sum / (2*m)
    return cost

def gradientDescent(X, y, theta, alpha, iters):  # 梯度下降
    temp = np.matrix(np.zeros(theta.shape))
    parameters = int(theta.ravel().shape[1])
    cost = np.zeros(iters)  # 每次迭代后的代价

    for i in range(iters):
        error = (X * theta.T) - y    # X 要增加一列1.data.insert(0,'ones',1)

        for j in range(parameters):  # n
            term = np.multiply(error, X[:,j])  # theta 1*n
            temp[0,j] = theta[0,j] - ((alpha / len(X)) * np.sum(term))

        theta = temp
        cost[i] = computercost(X, y, theta)

    return theta, cost


# 正规方程
def normalEqn(X, y):
    theta = np.linalg.inv(X.T@X)@X.T@y  #X.T@X等价于X.T.dot(X)
    return theta


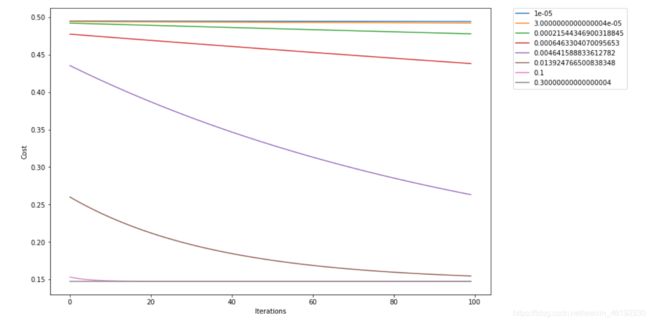
# 看看不同学习率的影响
data = pd.read_csv('ex1data1.txt',header=None,names=['Population','Profit'])
data=normalize_feature(data)
X=get_X(data)
y=get_y(data)

base = np.logspace(-1, -5, num=4)  # 一堆学习率,看看不同学习率对下降的影响
candidate = np.sort(np.concatenate((base, base*3)))  # 数组的拼接
print(candidate)       # 大佬这么写肯定有他们的道理。。。。
>>>
[1.00000000e-05 3.00000000e-05 2.15443469e-04 6.46330407e-04
 4.64158883e-03 1.39247665e-02 1.00000000e-01 3.00000000e-01]


theta = np.matrix(np.zeros(X.shape[1]))
fig, ax = plt.subplots(figsize=(12,8))
iters = 100
for i in candidate:
    theta ,cost = gradientDescent(X, y, theta, i, iters)
    ax.plot(np.arange(iters), cost, label=i)

ax.set_xlabel('Iterations')
ax.set_ylabel('Cost')
ax.legend(bbox_to_anchor=(1.05, 1), loc=2, borderaxespad=0.)
plt.show()

# 可以看出学习率过大,过小都是不适合的
高级版
反正目前看不懂,,就图一乐。。。。
from sklearn import linear_model
model = linear_model.LinearRegression()
model.fit(X, y)
x = np.array(X[:, 1].A1)
f = model.predict(X).flatten()             # 得到的应该是拟合线上的预测值。

fig, ax = plt.subplots(figsize=(12,8))
ax.plot(x, f, 'r', label='Prediction')
ax.scatter(data.Population, data.Profit, label='Traning Data')
ax.legend(loc=2)
ax.set_xlabel('Population')
ax.set_ylabel('Profit')
ax.set_title('Predicted Profit vs. Population Size')
plt.show()

# 这个就图一乐。。。等以后在解决吧。。。
def linear_regression(X_data, y_data, alpha, epoch, optimizer=tf.train.GradientDescentOptimizer):
      # placeholder for graph input
    X = tf.placeholder(tf.float32, shape=X_data.shape)
    y = tf.placeholder(tf.float32, shape=y_data.shape)

    # construct the graph
    with tf.variable_scope('linear-regression'):
        W = tf.get_variable("weights",
                            (X_data.shape[1], 1),
                            initializer=tf.constant_initializer())  # n*1

        y_pred = tf.matmul(X, W)  # m*n @ n*1 -> m*1

        loss = 1 / (2 * len(X_data)) * tf.matmul((y_pred - y), (y_pred - y), transpose_a=True)  # (m*1).T @ m*1 = 1*1

    opt = optimizer(learning_rate=alpha)
    opt_operation = opt.minimize(loss)

    # run the session
    with tf.Session() as sess:
        sess.run(tf.global_variables_initializer())
        loss_data = []

        for i in range(epoch):
            _, loss_val, W_val = sess.run([opt_operation, loss, W], feed_dict={X: X_data, y: y_data})
            loss_data.append(loss_val[0, 0])  # because every loss_val is 1*1 ndarray

            if len(loss_data) > 1 and np.abs(loss_data[-1] - loss_data[-2]) < 10 ** -9:  # early break when it's converged
                # print('Converged at epoch {}'.format(i))
                break

    # clear the graph
    tf.reset_default_graph()
    return {'loss': loss_data, 'parameters': W_val}  # just want to return in row vector format
逻辑回归
就是拟合出一个边界,将数据分为0,1 两类。
import numpy as np
import pandas as pd
import matplotlib.pyplot as plt

path = 'ex2data1.txt'
data = pd.read_csv(path, header=None, names=['Exam 1', 'Exam 2', 'Admitted'])
data.head()
Exam 1	Exam 2	Admitted
0	34.623660	78.024693	0
1	30.286711	43.894998	0
2	35.847409	72.902198	0
3	60.182599	86.308552	1
4	79.032736	75.344376	1

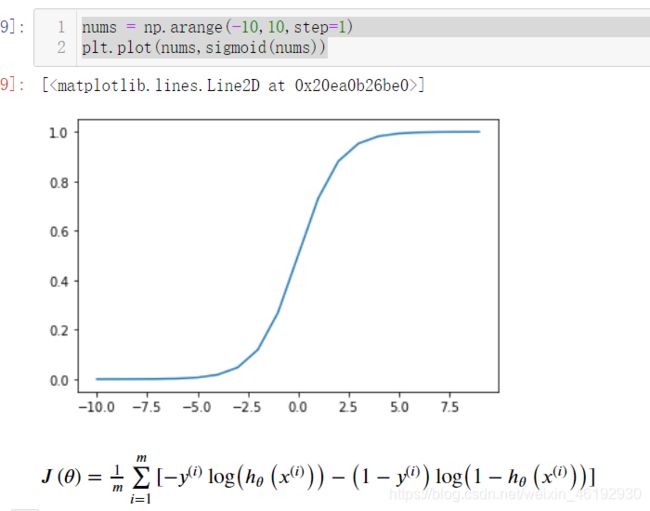
def sigmoid(z):              # 就是那个Logistics函数
    return 1/(1+np.exp(-z))

def cost(theta, X, y):           # 代价函数
    theta = np.matrix(theta)
    X = np.matrix(X)
    y = np.matrix(y)
    first = np.multiply(-y, np.log(sigmoid(X * theta.T)))
    second = np.multiply((1 - y), np.log(1 - sigmoid(X * theta.T)))
    return np.sum(first - second) / (len(X))

def gradient(theta,X,y):        # 梯度下降的导数部分
    theta = np.matrix(theta)
    X = np.matrix(X)
    y = np.matrix(y)

    parameters = int(theta.ravel().shape[1])   # n
    grad = np.zeros(parameters)
    error = sigmoid(X * theta.T) - y

    for i in range(parameters):
        term = np.multiply(error, X[:,i])  # X[:,0] = 1
        grad[i] = np.sum(term) / len(X)

    return grad

def gradient2(theta, X, y):      # 这个也可以啊,更简单
    return (1 / len(X)) * X.T @ (sigmoid(X @ theta.T) - y)
#  y m*1 X m*n theta 1*n

def predict(theta, X):     # 预测,,X 是实际数据,theta是学习出来的边界,将数据分为0,1两类
    probability = sigmoid(X * theta.T)
    return [1 if x >= 0.5 else 0 for x in probability]    # 0.5为界线

def predict2(x, theta):
    prob = sigmoid(x @ theta)
    return (prob >= 0.5).astype(int)   # 哇哦,这个真是厉害。。>0.5为1,小于为0


X=get_X(data)
y=get_y(data)
theta = np.matrix(np.zeros(X.shape[1]))
X.shape, theta.shape, y.shape
>>> ((100, 3), (1, 3), (100, 1))


import scipy.optimize as opt          # 使用这个科学计算包进行梯度下降
result = opt.fmin_tnc(func=cost, x0=theta, fprime=gradient, args=(X, y))
result
>>> (array([-25.16131872,   0.20623159,   0.20147149]), 36, 0)

res = opt.minimize(fun=cost, x0=theta, args=(X, y), method='Newton-CG', jac=gradient)
res
>>>
    fun: 0.2034977018633035
     jac: array([-2.12380382e-05, -1.40885753e-03, -1.27811598e-03])
 message: 'Optimization terminated successfully.'            # 以一种优化,这返回的啥。。
    nfev: 72
    nhev: 0
     nit: 28
    njev: 186
  status: 0
 success: True
       x: array([-25.16007951,   0.20622062,   0.20146256])    # 结果是一样的

from sklearn.metrics import classification_report#这个包是评价报告
def predict(x, theta):
    prob = sigmoid(x @ theta)
    return (prob >= 0.5).astype(int)
final_theta = res.x
y_pred = predict(X, final_theta)

print(classification_report(y, y_pred))   # 这个评价报告返回的好详细啊
>>>
                precision    recall  f1-score   support   # 查准率,召回率,F1值,另一个不知道但以后会知道的

           0       0.87      0.85      0.86        40
           1       0.90      0.92      0.91        60

    accuracy                           0.89       100
   macro avg       0.89      0.88      0.88       100
weighted avg       0.89      0.89      0.89       10


def accuracy(result,X,y):     # 判断一下正确率
    theta_min = np.matrix(result[0])
    predictions = predict(theta_min, X)
    correct = [1 if ((a == 1 and b == 1) or (a == 0 and b == 0)) else 0 for (a, b) in zip(predictions, y)]
    # 大佬的思路就是厉害。。。
    accuracy = (sum(map(int, correct)) % len(correct))  # 转换成整型在求和
    print ('accuracy = {0}%'.format(accuracy))

accuracy(result,X)
>>>accuracy = 89%        # 所有样本中预测正确的,应该不是查准率或召回率吧。.
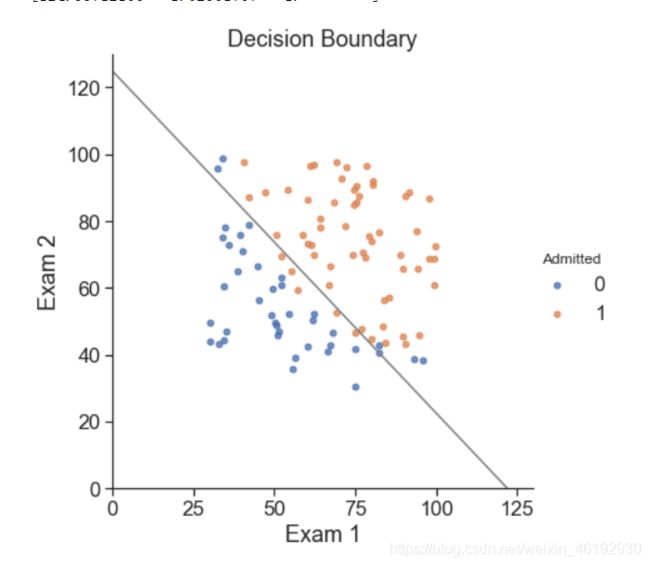
#   看一下决策边界的样子
coef = -(res.x / res.x[2])  # 构建方程,,有点迷
print(coef)    #   t0+ t1x1 + t2x2 = 0 -> x2 = -(t0/t2 + t1/t2 * x1)

x = np.arange(130, step=0.1)
y = coef[0] + coef[1]*x

sns.set(context="notebook", style="ticks", font_scale=1.5)

sns.lmplot('Exam 1', 'Exam 2', hue='Admitted', data=data,
           size=6,
           fit_reg=False,
           scatter_kws={"s": 25}
          )

plt.plot(x, y, 'grey')
plt.xlim(0, 130)
plt.ylim(0, 130)
plt.title('Decision Boundary')
plt.show()
正则化逻辑回归
解决过拟合的问题来着。。。
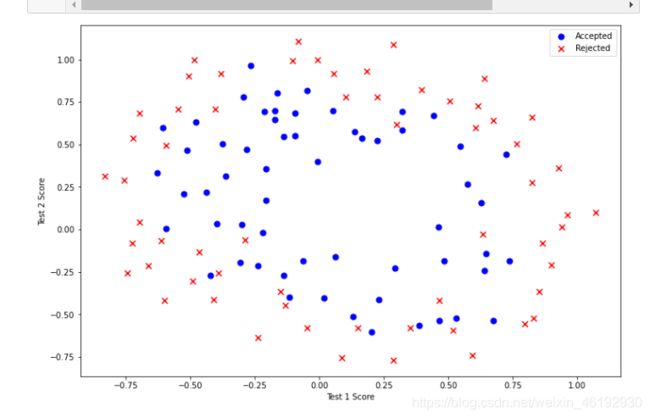
应对这种非线性的数据分类问题,构建的特征方程应该是 多项式特征。。
path =  'ex2data2.txt'
data2 = pd.read_csv(path, header=None, names=['Test 1', 'Test 2', 'Accepted'])
data2.head()
	Test 1	Test 2	Accepted       # 这里只有两个特征 x1, x2 再加一个 x0
0	0.051267	0.69956	1
1	-0.092742	0.68494	1               # 二维的数据应该就构建两个特征吧。。
2	-0.213710	0.69225	1
3	-0.375000	0.50219	1
4	-0.513250	0.46564	1

degree = 5
x1 = data2['Test 1']
x2 = data2['Test 2']

data2.insert(3, 'Ones', 1)

for i in range(1, degree):   # 1,2,3,4
    for j in range(0, i):
        data2['F' + str(i) + str(j)] = np.power(x1, i-j) * np.power(x2, j)   # x1**(i-j) * x2**j
        # x0 x1 x1^2 x1^2*x2 x1^3 x1^3*x2 x1^3*x2^2 ............ 就类似这样的

data2.drop('Test 1', axis=1, inplace=True)
data2.drop('Test 2', axis=1, inplace=True)

data2.head()
	Accepted	Ones	F10	F20	F21	F30	F31	F32	F40	F41	F42	F43   # 对应特征的次方
0	1	1	0.051267	0.002628	0.035864	0.000135	0.001839	0.025089	0.000007	0.000094	0.001286	0.017551
1	1	1	-0.092742	0.008601	-0.063523	-0.000798	0.005891	-0.043509	0.000074	-0.000546	0.004035	-0.029801
2	1	1	-0.213710	0.045672	-0.147941	-0.009761	0.031616	-0.102412	0.002086	-0.006757	0.021886	-0.070895
3	1	1	-0.375000	0.140625	-0.188321	-0.052734	0.070620	-0.094573	0.019775	-0.026483	0.035465	-0.047494
4	1	1	-0.513250	0.263426	-0.238990	-0.135203	0.122661	-0.111283	0.069393	-0.062956	0.057116	-0.051818
代价函数
J ( θ ) = 1 m ∑ i = 1 m [ − y ( i ) log ( h θ ( x ( i ) ) ) − ( 1 − y ( i ) ) log ( 1 − h θ ( x ( i ) ) ) ] + λ 2 m ∑ j = 1 n θ j 2 J\left( \theta \right)=\frac{1}{m}\sum\limits_{i=1}^{m}{[-{{y}^{(i)}}\log \left( {{h}_{\theta }}\left( {{x}^{(i)}} \right) \right)-\left( 1-{{y}^{(i)}} \right)\log \left( 1-{{h}_{\theta }}\left( {{x}^{(i)}} \right) \right)]}+\frac{\lambda }{2m}\sum\limits_{j=1}^{n}{\theta _{j}^{2}} J(θ)=m1i=1∑m[−y(i)log(hθ(x(i)))−(1−y(i))log(1−hθ(x(i)))]+2mλj=1∑nθj2
def costReg(theta,X,y,learningRate):   # 代价函数
    theta = np.matrix(theta)
    y = np.matrix(y)
    X = np.matrix(X)  # 学习率是一种超参数,控制正则化项
    first = np.multiply(-y, np.log(sigmoid(X * theta.T)))
    second = np.multiply((1 - y), np.log(1 - sigmoid(X * theta.T)))
    reg = (learningRate/(2*(len(X)))) * np.sum(np.power(theta[:,1:],2))
    return np.sum(first - second) / len(X) + reg


def gradientReg(theta, X, y, learningRate):  # 导数部分
    theta = np.matrix(theta)
    X = np.matrix(X)
    y = np.matrix(y)

    parameters = int(theta.ravel().shape[1])  # n
    grad = np.zeros(parameters)

    error = sigmoid(X * theta.T) - y   # 一个常数

    for i in range(parameters):
        term = np.multiply(error, X[:,i])

        if (i == 0):
            grad[i] = np.sum(term) / len(X)   # 对theta0 不进行正则化
        else:
            grad[i] = (np.sum(term) / len(X)) + ((learningRate / len(X)) * theta[:,i])

    return grad    # 返回数组,对应每一个theta

cols = data2.shape[1]      # 还是手动构建数据的结构吧,,那啥啥函数太烦了。。
X2 = data2.iloc[:,1:cols]
y2 = data2.iloc[:,0:1]
learningRate = 1
X2 = np.array(X2.values)
y2 = np.array(y2.values)
theta2 = np.zeros(11)
X2.shape,y2.shape,theta2.shape
>>> ((118, 11), (118, 1), (11,))

result2 = opt.fmin_tnc(func=costReg, x0=theta2, fprime=gradientReg, args=(X2, y2, learningRate))
result2              # 代价函数,代价函数的导数
>>>(array([ 0.53010248,  0.29075567, -1.60725764, -0.58213819,  0.01781027,
        -0.21329508, -0.40024142, -1.37144139,  0.02264304, -0.9503358 ,
         0.0344085 ]),
 22,
 1)
accuracy(result2,X2,y2)
>>> accuracy = 78%
另一个版本,感觉更厉害些(因为看不懂),,,,
df = pd.read_csv('ex2data2.txt', names=['test1', 'test2', 'accepted'])
df.head()
   test1	test2	accepted
0	0.051267	0.69956	1
1	-0.092742	0.68494	1
2	-0.213710	0.69225	1
3	-0.375000	0.50219	1
4	-0.513250	0.46564	1

def feature_mapping(x, y, power, as_ndarray=False):     # 构建多项式

    data = {"f{}{}".format(i - p, p): np.power(x, i - p) * np.power(y, p)
                for i in np.arange(power + 1)
                for p in np.arange(i + 1)
            }   # 虽然效果一样,但这个看着就np 。。。

    if as_ndarray:
        return np.pd.DataFrame(data).values  # array
    else:
        return pd.DataFrame(data)

x1 = np.array(df.test1)
x2 = np.array(df.test2)
data = feature_mapping(x1, x2, power=6)
print(data.shape)
data.head()      # 这里构建了28个多项式
	f00	f10	f01	f20	f11	f02	f30	f21	f12	f03	...	f23	f14	f05	f60	f51	f42	f33	f24	f15	f06
0	1.0	0.051267	0.69956	0.002628	0.035864	0.489384	0.000135	0.001839	0.025089	0.342354	...	0.000900	0.012278	0.167542	1.815630e-08	2.477505e-07	0.000003	0.000046	0.000629	0.008589	0.117206
1	1.0	-0.092742	0.68494	0.008601	-0.063523	0.469143	-0.000798	0.005891	-0.043509	0.321335	...	0.002764	-0.020412	0.150752	6.362953e-07	-4.699318e-06	0.000035	-0.000256	0.001893	-0.013981	0.103256
2	1.0	-0.213710	0.69225	0.045672	-0.147941	0.479210	-0.009761	0.031616	-0.102412	0.331733	...	0.015151	-0.049077	0.158970	9.526844e-05	-3.085938e-04	0.001000	-0.003238	0.010488	-0.033973	0.110047
3	1.0	-0.375000	0.50219	0.140625	-0.188321	0.252195	-0.052734	0.070620	-0.094573	0.126650	...	0.017810	-0.023851	0.031940	2.780914e-03	-3.724126e-03	0.004987	-0.006679	0.008944	-0.011978	0.016040
4	1.0	-0.513250	0.46564	0.263426	-0.238990	0.216821	-0.135203	0.122661	-0.111283	0.100960	...	0.026596	-0.024128	0.021890	1.827990e-02	-1.658422e-02	0.015046	-0.013650	0.012384	-0.011235	0.010193
5 rows × 28 columns


theta = np.zeros(data.shape[1])
print(theta.shape)
X = feature_mapping(x1, x2, power=6, as_ndarray=True)     # 这里都是array 数组,,不要用矩阵啊
print(X.shape)
y=np.array(df.iloc[:,-1])
print(y.shape)
(28,)
(118, 28)
(118,)

def regularized_cost(theta, X, y, learningRate=1):    # 这个大佬写的就是简洁。。。
    theta_j1_to_n = theta[1:]   # 不对theta0 正则化
    regularized_term = (learningRate / (2 * len(X))) * np.power(theta_j1_to_n, 2).sum()

    return cost(theta, X, y) + regularized_term

# 正则项前面的代价函数,在上面的逻辑回归中定义的,,就是简洁
def cost(theta, X, y):
    return np.mean(-y * np.log(sigmoid(X @ theta)) - (1 - y) * np.log(1 - sigmoid(X @ theta)))

regularized_cost(theta, X, y, learningRate=1)
>>> 0.6931471805599454


def regularized_gradient(theta, X, y, l=1):  # 导数部分
    theta_j1_to_n = theta[1:]
    regularized_theta = (l / len(X)) * theta_j1_to_n

    regularized_term = np.concatenate([np.array([0]), regularized_theta])
    g=gradient(theta, X, y).T
    return np.array(g + regularized_term)

def gradient(theta, X, y):      # 就是简洁。。。
    return (1 / len(X)) * X.T @ (sigmoid(X @ theta.T) - y.T)

regularized_gradient(theta, X, y)
array([[8.47457627e-03, 1.87880932e-02, 7.77711864e-05, 5.03446395e-02,
        1.15013308e-02, 3.76648474e-02, 1.83559872e-02, 7.32393391e-03,
        8.19244468e-03, 2.34764889e-02, 3.93486234e-02, 2.23923907e-03,
        1.28600503e-02, 3.09593720e-03, 3.93028171e-02, 1.99707467e-02,
        4.32983232e-03, 3.38643902e-03, 5.83822078e-03, 4.47629067e-03,
        3.10079849e-02, 3.10312442e-02, 1.09740238e-03, 6.31570797e-03,
        4.08503006e-04, 7.26504316e-03, 1.37646175e-03, 3.87936363e-02]])

import scipy.optimize as opt
print('init cost = {}'.format(regularized_cost(theta, X, y)))

res = opt.minimize(fun=regularized_cost, x0=theta, args=(X, y), method='Newton-CG', jac=regularized_gradient)                 # 进行梯度下降
res
>>>                                   # 这返回的啥
init cost = 0.6931471805599454
     fun: 0.529002729712739
     jac: array([ 7.26089191e-08,  4.22913232e-09,  8.15815876e-09,  6.15699190e-08,
        7.74567232e-09, -3.09360466e-08,  2.12821347e-08,  1.22156735e-08,
        1.96058084e-08, -3.19108791e-08, -4.39405717e-09, -2.76847096e-09,
       -2.77934021e-08,  1.23592858e-08, -7.14474161e-08,  8.98276579e-09,
        1.45962365e-08, -1.00120216e-08, -7.32796823e-09,  1.43317535e-08,
       -4.38679455e-08, -4.85023121e-09, -3.40732357e-10, -1.11668147e-08,
       -5.01047274e-09, -1.44326742e-08,  8.78794915e-09, -5.71951122e-08])
 message: 'Optimization terminated successfully.'
    nfev: 7
    nhev: 0
     nit: 6
    njev: 57
  status: 0
 success: True
       x: array([ 1.27273909,  0.62527214,  1.18108783, -2.01995993, -0.91742426,
       -1.43166279,  0.12400726, -0.36553444, -0.35723901, -0.17513021,
       -1.45815774, -0.05098947, -0.61555653, -0.27470644, -1.19281683,
       -0.24218793, -0.20600565, -0.04473137, -0.27778488, -0.2953778 ,
       -0.45635711, -1.04320321,  0.02777158, -0.29243198,  0.01556636,
       -0.32738013, -0.14388704, -0.92465213])    # 这应该就是最优化的theta了。。

def predict(x, theta):
    prob = sigmoid(x @ theta)
    return (prob >= 0.5).astype(int)
from sklearn.metrics import classification_report#这个包是评价报告
final_theta = res.x
y_pred = predict(X, final_theta)

print(classification_report(y, y_pred))
>>>
                  precision    recall  f1-score   support      # 好长啊。。。。

           0       0.90      0.75      0.82        60
           1       0.78      0.91      0.84        58

    accuracy                           0.83       118
   macro avg       0.84      0.83      0.83       118
weighted avg       0.84      0.83      0.83       118
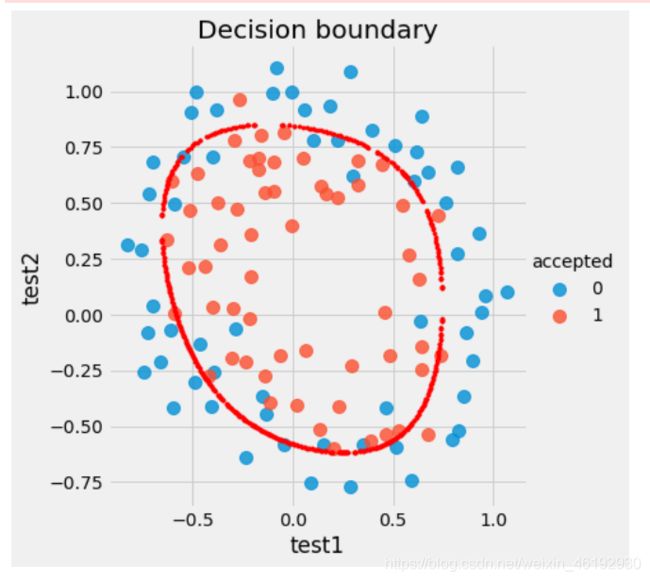
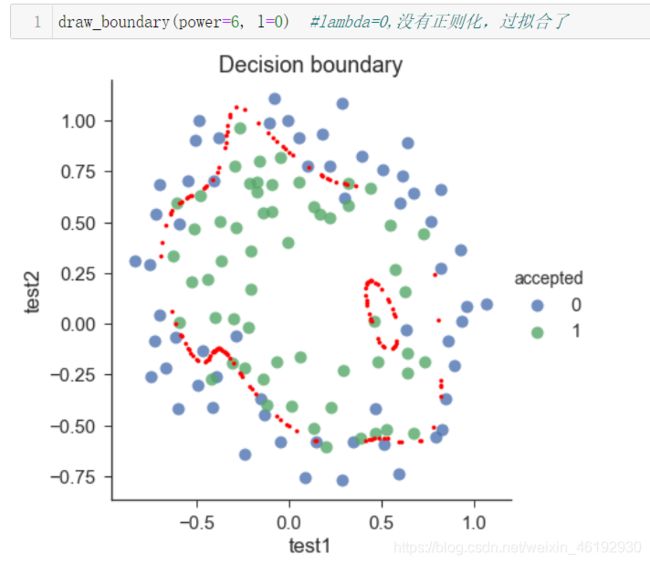
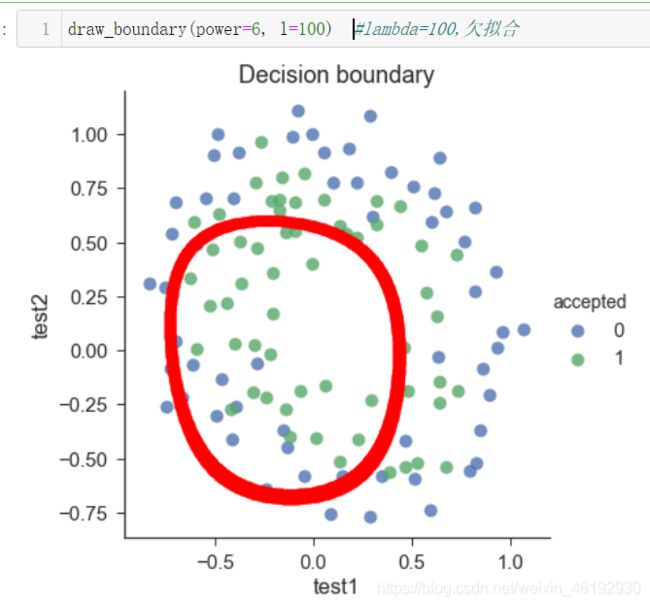
看看不同 λ \lambda λ 的决策边界
def draw_boundary(power, l):   # 画图

    density = 1000
    threshhold = 2 * 10**-3

    final_theta = feature_mapped_logistic_regression(power, l)
    x, y = find_decision_boundary(density, power, final_theta, threshhold)

    df = pd.read_csv('ex2data2.txt', names=['test1', 'test2', 'accepted'])
    sns.lmplot('test1', 'test2', hue='accepted', data=df, size=6, fit_reg=False, scatter_kws={"s": 100})

    plt.scatter(x, y, c='R', s=10)
    plt.title('Decision boundary')
    plt.show()


def feature_mapped_logistic_regression(power, l): # 一个函数获取最有的theta...

    df = pd.read_csv('ex2data2.txt', names=['test1', 'test2', 'accepted'])
    x1 = np.array(df.test1)
    x2 = np.array(df.test2)
    y=np.array(df.iloc[:, -1])

    X = feature_mapping(x1, x2, power, as_ndarray=True)
    theta = np.zeros(X.shape[1])

    res = opt.minimize(fun=regularized_cost,
                       x0=theta,
                       args=(X, y, l),
                       method='TNC',
                       jac=regularized_gradient)
    final_theta = res.x

    return final_theta

def find_decision_boundary(density, power, theta, threshhold):
    t1 = np.linspace(-1, 1.5, density)
    t2 = np.linspace(-1, 1.5, density)   # 两个等差数组

    cordinates = [(x, y) for x in t1 for y in t2]
    x_cord, y_cord = zip(*cordinates)    # 这画到坐标轴的话应该是一个实心矩形
    mapped_cord = feature_mapping(x_cord, y_cord, power)  # this is a dataframe
   # 映射后是不是就变成了一个圆形了。。。1000000 rows × 28 columns
    inner_product = mapped_cord.values @ theta  # theta  28*1
   # 这下面我是真的看不懂了。。。。这个阈值还有上面的 -1-1.5 怎么选的。。。
    decision = mapped_cord[np.abs(inner_product) < threshhold]

    return decision.f10, decision.f01
#寻找决策边界函数
draw_boundary(power=6, l=1) #lambda=1
高级的
现在的我连调参侠都不配啊。。。。。
from sklearn import linear_model#调用sklearn的逻辑回归包
model = linear_model.LogisticRegression(penalty='l2', C=1.0)
model.fit(X2, y2.ravel())
model.score(X2, y2)
>>> 0.6610169491525424    # 不会调参,所以正确率不高。。。
好难啊,,,,整整看了三天。。。
