综合项目:人工智能领域目前职位及薪资现状分析 - 基于主流招聘网站信息
本文基于对三大主流招聘网站收集的信息进行清洗、处理、转换的基础上,对当前人工智能领域的行业现状进行了简要分析。通过对数据的特征工程处理生成适合于机器学习算法的数据集,并利用数据集对目前主流的分类算法分别训练了分类模型,并通过模型在测试集上的准确度对各算法的优缺点进行了简要的分析。
具体项目流程及使用的工具:

主要分析结果展示:
……
机器学习算法部分:


以下部分为正文:
-
- 0 项目介绍
- 0.1 项目背景介绍
- 0.2 项目开发准备
- 0.2.1 操作系统
- 0.2.2 开发工具
- 0.2.3 python版本
- 0.2.4 第三方模块
- 1 数据收集
- 1.1 51job网站
- 1.1.1 数据收集目标
- 1.1.2 代码实现
- 1.2 智联招聘网站
- 1.3 猎聘招聘网站
- 1.3.1 数据收集目标
- 1.3.2 代码实现
- 1.1 51job网站
- 2 51job网站数据清洗及分析
- 2.1 数据查看
- 2.1.1 导入数据
- 2.1.2 数据查重及重复行删除
- 2.2 数据清洗及分析
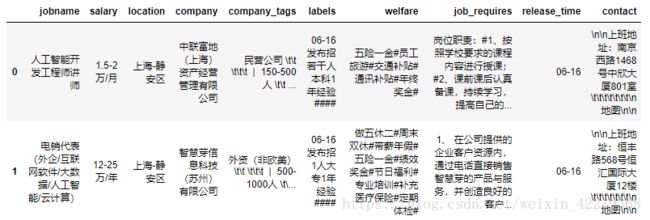
- 2.2.1 原始数据结构查看
- 2.2.2 company_tags数据处理分析
- 2.2.2.1 company_tags清洗
- 2.2.2.2 对公司的性质及大小进行统计分析
- 2.2.2.3 分析结果图表展示
- 2.2.3 welfare 数据处理分析
- 2.2.3.1 welfare 数据拆分
- 2.2.3.2 welfare 数据合并分析
- 2.2.3.3 welfare 数据合并后数据处理
- 2.2.3.4 welfare 数据合并后分析结果可视化展示
- 2.2.4 labels 数据处理分析
- 2.2.4.1 labels 数据清洗
- 2.2.4.2 labels 数据拆分 – 拆分出学历与工作经验
- 2.2.4.3 labels 数据拆分 – 学历与工作经验拆分
- 2.2.4.3 labels 数据拆分 – 在de_new中新增加学历与工作经验两列数据
- 2.2.5 salary 数据处理
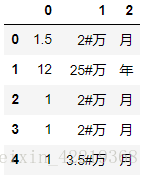
- 2.2.5.1 salary 数据清洗-1
- 2.2.5.2 salary 数据清洗-2
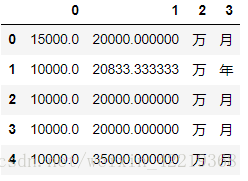
- 2.2.5.3 salary 数据清洗-3:将salary的上下限单位变为元
- 2.2.5.4 salary 数据清洗-3:将salary的年工资变为月工资
- 2.2.5.5 在原数据df_new中增加一列:工资的平均值-salary_mean
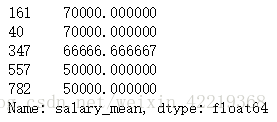
- 2.2.5.6 查看df_new[‘salary_mean’]并处理极端值
- 2.2.6 探查工资平均水平与学历、工作经验的关系
- 2.2.6.1 将工资数据按照学历、工作经验分组后求平均值
- 2.2.6.2 分析结果图表展示
- 2.2.7 各公司对英语的要求
- 2.2.7.1 查看一下含英语标签
- 2.2.7.2 标签拆分
- 2.2.7.2 英语需求统计分析结果图表展示
- 2.2.8 job_requires文本内容关键词提取分析
- 2.2.8.1 通过第三方模块jieba进行关键词提取
- 2.2.8.2 对提取的关键词进行清洗
- 2.2.8.3 关键词词频分析图表展示
- 2.2.9 salary优化处理
- 2.2.9.1 数据清洗
- 2.2.9.2 分析结果图表展示
- 2.1 数据查看
- 3 智联招聘网站数据分析
- 3.1 数据探索
- 3.1.1 分别导入各地数据,并合并数据
- 3.1.2 数据查重及删除重复行
- 3.2 welfare数据清洗
- 3.2.1 welfare 按照地区拆分清洗
- 3.2.1.1 北京地区数据重复值处理
- 3.2.1.2 北京地区数据重复值处理-1
- 3.2.1.3 北京地区数据重复值处理-2:取前10个关键词
- 3.2.2 其他地区处理方式同北京地区数据
- 3.2.3 welfare数据按地区处理结果图表展示
- 3.2.1 welfare 按照地区拆分清洗
- 3.3 salary 数据清洗
- 3.3.1 salary 数据拆分清洗-1
- 3.3.2 salary 数据拆分清洗-1将‘面议’及对工资低于‘6000’的值进行过滤
- 3.3.3 df_new增加一列新的数据salary_mean
- 3.4 平均工资与学历、工作经验的关系
- 3.4.1 将工资按照学历、工作经验分类后求均值
- 3.4.1.1 工资与学历的关系
- 3.4.1.2 工资与工作经验的关系
- 3.4.2 工资水平与学历、工作经验分析结果图表展示
- 3.4.3 工资水平与地区分析结果图表展示
- 3.4.3.1 地区数据清洗
- 3.4.3.2 地区数据分析结果图表展示
- 3.4.1 将工资按照学历、工作经验分类后求均值
- 3.1 数据探索
- 4 猎聘网站数据清洗及分析
- 4.1 数据导入
- 4.2 数据查重
- 4.3 查重结果分析
- 5 通过数据构建机器学习算法模型
- 5.1 特征工程 - 数据集准备
- 5.1.1 查看数据
- 5.1.2 对location数据进行处理
- 5.1.2.1 查看一下数据
- 5.1.2.2 location数据one-hot编码处理
- 5.1.3 company_attr数据处理
- 5.1.3.1 查看一下数据
- 5.1.3.2 对company_attr数据进行清洗
- 5.1.3.3 company_attr数据one-hot编码处理
- 5.1.4 company_size数据处理
- 5.1.4.1 查看数据
- 5.1.4.2 将分错数据使用众数代替
- 5.1.4.3 company_size数据one-hot编码处理
- 5.1.5 welfare数据处理
- 5.1.5.1 合并数据
- 5.1.5.2 统计公司提供福利个数作为统计参数
- 5.1.6 edu数据处理
- 5.1.6.1 查看并合并数据
- 5.1.6.2 edu数据onehot编码
- 5.1.7 experience数据onehot编码
- 5.1.8 english_requires数据处理
- 5.1.8.1 english_requires简化处理
- 5.1.8.1 english_requires数据onehot编码
- 5.1.9 salary数据处理
- 5.1.9.1 求均值
- 5.1.9.2 均值小于6000的部分全部替换为np.nan值
- 5.1.9.3 将salary_mean加入数据中
- 5.1.10 所有数据合并
- 5.1.10.1 删除所有出现NaN的行数据 - 主要是salary数据中出现的nan值
- 5.1.11 将数据集写入文件存储
- 5.2 尝试使用聚类算法k-means对数据进行分类
- 5.2.1 读入数据
- 5.2.1.1 导入模块
- 5.2.1.2 读入数据
- 5.2.2 数据查看与极端值处理
- 5.2.3 利用肘部法则来调参 - 挑选最合适的K值
- 5.2.4 可视化展示
- 5.2.4.1 对salary_mean数据进行标记
- 5.2.4.2 数据准备
- 5.2.4.3 图表展示
- 5.2.5 k-means模型
- 5.2.1 读入数据
- 5.3 主流分类算法在数据集上的效果分析
- 5.3.1 准备数据集
- 5.3.2 拆分训练集和数据集
- 5.3.3 训练模型
- 5.3.3.1 LogisticRegression
- 5.3.3.1.1**逻辑回归模型误分类矩阵图表展示**
- 5.3.3.2 SVM
- 5.3.3.3 KNN
- 5.3.3.4 Descition Tree
- 5.3.3.5 Random Forest
- 5.3.3.1 LogisticRegression
- 5.3.4 各模型结果分析
- 5.3.4.1 各模型结果对比
- 5.3.4.2 对比分析结论:
- 5.1 特征工程 - 数据集准备
- 0 项目介绍
0 项目介绍
0.1 项目背景介绍
当前,人工智能(AI)是个非常热门的话题,近几年基于海量数据分析的人工智能正在不断的改变我们的生活方式,无人驾驶技术、图像识别、新闻推荐、广告精准投放……可谓无孔不入。那么如果想要进入人工智能领域的话需要拥有那些技术呢?当前人工智能领域工资大致为多少?工资的高低到底和什么因素相关,学历?专业?还是工作经验呢……
本文从招聘网站入手,通过BeautifulSoup + requests、Selenium收集了3大主流网站的人工智能领域的数据,并通过pandas、numpy对数据进行清洗、转换与分析,并通过matplotlib对分析结果进行可视化图表展示。
最后,通过对收集数据进行了特征工程处理,抽取了主要特征参数,并进行相应的数据转换最终生成数据集,通过scikit-learn对数据集进行拆分,并对目前主流的分类算法分别训练了分类模型,并通过模型在测试集上的准确度对各算法的优缺点进行了简要的分析。
0.2 项目开发准备
0.2.1 操作系统
· windows
0.2.2 开发工具
· Pycharm
· Anaconda
· Jupyter notebook
0.2.3 python版本
· python3.6
0.2.4 第三方模块
· urllib + re正则模块
· BeautifulSoup + Requests
· selenium
· numpy
· pandas
· matplotlib
· sk_learn
· jieba - 分词模块
1 数据收集
1.1 51job网站
通过对51job网站的分析,明确主要收集的数据目标有:
1.1.1 数据收集目标
· jobname
· salary
· campany
· location
· company_tags
· labels
· welfare
· job_requires
· release_time
· contact
1.1.2 代码实现
from bs4 import BeautifulSoup
import requests
import random
import chardet
from urllib.request import quote,unquote
import csv
import time

def get_html(url):
    User_Agent = [……]
    http = [……]
    https = [……]
    proxies1 = {'HTTP': random.choice(http), 'HTTPS': random.choice(https)}
    r=requests.get(url, headers={'User-Agent':random.choice(User_Agent)},proxies=proxies1)
    code=chardet.detect(r.content)['encoding']
    r.encoding=code
    return r.text

datalist=[]
count = 1

def get_save_data(jobname,get_pages):
    global count
    with open('51job职位信息 -- '+jobname+'_20_2.csv','w',newline='',encoding='utf8') as outfile:
        writer=csv.writer(outfile)

        info_list = ['count','jobname', 'salary', 'location', 'company', 'company_tags', 'labels', 'welfare','job_requires', 'release_time', 'contact']
        writer.writerow(info_list)
        for page in range(1,get_pages+1):

        # 在实际数据收集过程中发现:如果采用将传入的职位关键词加密的形式加入到链接中,会出现第一页可以匹配,第二页完全匹配不上的问题,我检查了一下原因,大致就是因为在进入第二页的时候,通过加密方式加入的职位关键词会发生变化,所以在实际代码实现的时候,不再传入职位关键词,而是直接使用原固定的链接的方式+页码的改变

            url_ai="https://search.51job.com/list/020000,000000,0000,00,9,99,%25E4%25BA%25BA%25E5%25B7%25A5%25E6%2599%25BA%25E8%2583%25BD,2,"+str(page)+".html?lang=c&stype=1&postchannel=0000&workyear=99&cotype=99°reefrom=99&jobterm=99&companysize=99&lonlat=0%2C0&radius=-1&ord_field=0&confirmdate=9&fromType=&dibiaoid=0&address=&line=&specialarea=00&from=&welfare="
            url_ml="……"
            url_datamining="……"
            url_bigdata="……"
            html=get_html(url_bigdata)  # 传入需要采集数据的对应的url
            print("-----------  第"+str(page)+"页  ----------")
            time.sleep(10)
            soup=BeautifulSoup(html,"html.parser")
            parent_div=soup.find('div',attrs={'id':'resultList'})
            all_divs=parent_div.find_all('div',attrs={'class':'el'})
            all_divs.pop(0)     # 删除第一个div(表头)

            for div in all_divs:
                print("---------------  第" + str(count) + "项  ---------------")
                data = []
                url_inner=div.find('a')['href']
                html_inner=get_html(url_inner)
                jobname=div.find('a')['title']
                company =div.find_all('span')[1].find('a')['title']
                location = div.find_all('span')[2].string
                salary = div.find_all('span')[3].string
                release_time = div.find_all('span')[4].string
                soup_inner=BeautifulSoup(html_inner,'html.parser')
                if soup_inner.find('div', attrs={'class': 'tCompanyPage'}):
                    parent_div_inner_1 = soup_inner.find('div', attrs={'class': 'tCompanyPage'})
                    try:
                        all_in_ps=parent_div_inner_1.find('div', attrs={'class': 'in'}).find_all('p')
                        if len(all_in_ps)==2:
                            company_tags=all_in_ps[1].get_text().strip()
                        else:
                            company_tags=''
                    except Exception:
                        company_tags=''
                    try:
                        parent_div_inner_2 = soup_inner.find('div', attrs={'class': 'tCompany_main'})
                        all_spans = parent_div_inner_2.find('div', attrs={'class': 't1'}).find_all('span')
                        labels = ''
                        for i in range(len(all_spans)):
                            labels = all_spans[i].get_text() + labels + '#'
                    except Exception:
                        labels=''
                    welfare=''
                    if parent_div_inner_1.find('p',attrs={'class':'t2'}):
                        all_span=parent_div_inner_1.find('p',attrs={'class':'t2'}).find_all('span')
                        for span in all_span:
                            welfare = welfare + span.string+'#'
                    all_tBorderTop_box=parent_div_inner_2.find_all('div',attrs={'class':'tBorderTop_box'})
                    if len(all_tBorderTop_box)==4:
                        all_tBorderTop_box.pop(0)
                    all_ps=all_tBorderTop_box[0].find_all('p')
                    job_requires= ''     # 职位信息
                    for p in all_ps:
                        job_requires = job_requires + p.get_text()+'#'
                    contact=all_tBorderTop_box[1].find('div').get_text()
                    # 依次向列表中加入目标数据
                    data.append(count)
                    data.append(jobname)
                    data.append(salary)
                    data.append(location)
                    data.append(company)
                    data.append(company_tags)
                    data.append(labels)
                    data.append(welfare)
                    data.append(job_requires)
                    data.append(release_time)
                    data.append(contact)
                    writer.writerow(data)
                    datalist.append(data)
                else:
                    continue
                count+=1
    return len(datalist)    # 返回最后获取的数据的长度
print(get_save_data('大数据',20))
在调试的过程中,发现:部分公司在发布信息时会出现与网页的模块不一致的情况,如使用if soup.find(tag)来判断的话,在找不到tag标签时会直接报错,而不是判断为False,非常影响后续程序的运行及代码调试,所以此处使用try语句跳过不符合网页模板的内容。
提醒:使用try后将不再报错,所以一定在代码调试到可以正常获取符合网页规范的所有目标内容的情况下再使用try语句过滤不规范的选项。
1.2 智联招聘网站
代码同样通过BS4+requests实现,但是在分析智联招聘网站时发现搜索不同的关键词时其网页的链接不同,所以需要单独为每个关键词设置url。
1.3 猎聘招聘网站
通过对猎聘网网站的分析发现:猎聘网为动态加载网站,猎聘网会记录你的每一步操作,并体现在网页网址上,因此需要使用selenium对其网页数据进行收集。
1.3.1 数据收集目标
· jobname
· company
· company_kind
· salary
· welfares
· require_labels
· job_describes
1.3.2 代码实现
url='https://www.liepin.com'
from selenium import webdriver
import csv
import time
from bs4 import BeautifulSoup
import requests
import random
import chardet
from urllib.request import quote,unquote
import csv
from selenium import *
from selenium.webdriver.common.keys import Keys

datalist=[]
count=1
def get_html(url):  # 使用bs4获取内层网页详细信息
    User_Agent = [……]
    http = [……]
    https = [……]
    proxies1 = {'HTTP': random.choice(http), 'HTTPS': random.choice(https)}
    r=requests.get(url, headers={'User-Agent':random.choice(User_Agent)},proxies=proxies1)
    code=chardet.detect(r.content)['encoding']
    r.encoding=code
    return r.text

def get_data(key_world,pages):
    driver=webdriver.Chrome()
    url='https://www.liepin.com'
    driver.get(url)
    element = driver.find_element_by_name('key')  # 找到搜索框元素
    for i in key_world:
        element.send_keys(i)  # 模拟键盘输入关键字的每个元素
        time.sleep(0.5)
    driver.find_element_by_xpath("//button[@type='submit']").click()  # 找到需要点击的键

    global count
    container=driver.find_element_by_class_name('sojob-list')
    all_lis=container.find_elements_by_tag_name('li')
    print(len(all_lis))
    for li in all_lis:
        print("********************  第"+str(count)+"项   ***************** ")
        data=[]
        try:
            jobname=li.find_element_by_class_name('job-info').find_element_by_tag_name('h3').get_attribute('title')
            url_inner=li.find_element_by_class_name('job-info').find_element_by_tag_name('h3').find_element_by_tag_name('a').get_attribute('href')
            print(url_inner)
            company=li.find_element_by_class_name('company-name').find_element_by_tag_name('a').text
            company_kind=li.find_element_by_class_name('field-financing').find_element_by_tag_name('a').text

            welfares=li.find_element_by_class_name('temptation').text

            html=get_html(url_inner)

            soup=BeautifulSoup(html,'html.parser')
            parent1=soup.find('div',attrs={'class':'clearfix'})
            # print(parent1.find('p'))
            if parent1.find('p'):
                salary=parent1.find('p').get_text().strip()
            else:salary=''
            require_labels = ''
            if parent1.find('div',attrs={'class':'job-qualifications'}):
                spans=parent1.find('div',attrs={'class':'job-qualifications'}).find_all('span')
                for span in spans:
                    require_labels=require_labels+span.string+'#'
            parent2=soup.find('div',attrs={'class':'about-position'}).find('div',attrs={'class':'job-description'})
            job_describes=parent2.find('div',attrs={'class':'content'}).get_text().strip()
            title = ['jobname', 'company', 'company_kind', 'salary' ,'welfares', 'require_labels', 'job_describes']
            data.append(jobname)
            data.append(company)
            data.append(company_kind)
            data.append(salary)
            data.append(welfares)
            data.append(require_labels)
            data.append(job_describes)
            datalist.append(data)

        except Exception:
            print('出错')
        count += 1

    top = driver.find_element_by_class_name("input-main")
    bottom = driver.find_element_by_class_name("pagerbar")
    from selenium.webdriver import ActionChains
    action_chains = ActionChains(driver)
    action_chains.drag_and_drop(top, bottom).perform()
    page_num = 2
    for i in range(pages-1):     # for循环点击下一页链接,控制获取内容
        time.sleep(5)
        element_n = driver.find_element_by_class_name('redirect').find_element_by_class_name('pn')  # 找到搜索框元素
        element_n.send_keys(page_num)  # 模拟键盘输入关键字的每个元素
        time.sleep(0.5)
        driver.find_element_by_class_name('redirect').find_element_by_tag_name('input').send_keys(Keys.ENTER)  # 找到需要点击的键
        print("***************   进入第" + str(page_num) + "页   ***************")

        container = driver.find_element_by_class_name('sojob-list')
        all_lis = container.find_elements_by_tag_name('li')
        print(len(all_lis))
        for li in all_lis:
            print("***********  第" + str(count) + "项   ********* ")
            # if count != 14:
            data = []
            try:
                jobname = li.find_element_by_class_name('job-info').find_element_by_tag_name('h3').get_attribute(
                    'title')
                url_inner = li.find_element_by_class_name('job-info').find_element_by_tag_name(
                    'h3').find_element_by_tag_name('a').get_attribute('href')
                print(url_inner)
                company = li.find_element_by_class_name('company-name').find_element_by_tag_name('a').text
                company_kind = li.find_element_by_class_name('field-financing').find_element_by_tag_name('a').text

                welfares = li.find_element_by_class_name('temptation').text
                html = get_html(url_inner)
                soup = BeautifulSoup(html, 'html.parser')
                parent1 = soup.find('div', attrs={'class': 'clearfix'})
                if parent1.find('p'):
                    salary = parent1.find('p').get_text().strip()
                else:
                    salary = ''
                require_labels = ''
                if parent1.find('div', attrs={'class': 'job-qualifications'}):
                    spans = parent1.find('div', attrs={'class': 'job-qualifications'}).find_all('span')
                    for span in spans:
                        require_labels = require_labels + span.string + '#'
                parent2 = soup.find('div', attrs={'class': 'about-position'}).find('div', attrs={
                    'class': 'job-description'})
                job_describes = parent2.find('div', attrs={'class': 'content'}).get_text().strip()
                title = ['jobname', 'company', 'company_kind', 'salary', 'welfares', 'require_labels',
                         'job_describes']
                data.append(jobname)
                data.append(company)
                data.append(company_kind)
                data.append(salary)
                data.append(welfares)
                data.append(require_labels)
                data.append(job_describes)
                datalist.append(data)

            except Exception:
                print('出错')
            count += 1
        top = driver.find_element_by_class_name("input-main")
        bottom = driver.find_element_by_class_name("pagerbar")
        from selenium.webdriver import ActionChains
        action_chains = ActionChains(driver)
        action_chains.drag_and_drop(top, bottom).perform()
        page_num+=1

    return '操作完成!'

def save_csv(key_word, pages):
    get_data(key_word, pages)
    with open('猎聘职位信息'+key_word+'_20.csv','w',encoding='utf8',newline='') as outfile:
        writer=csv.writer(outfile)
        title = ['jobname', 'company', 'company_kind', 'salary', 'welfares', 'require_labels', 'job_describes']
        writer.writerow(title)
        for data in datalist:
            writer.writerow(data)
save_csv('大数据',25)   # 输入关键词和需要获取的页数
2 51job网站数据清洗及分析
2.1 数据查看
2.1.1 导入数据
import numpy as np
import pandas as pd

ai_file=open('./01-51job/51job职位信息 -- 人工智能_20.csv','r',encoding='utf-8')
df=pd.read_csv(ai_file,
              names=['jobname', 'salary', 'location', 'company', 'company_tags', 'labels', 'welfare','job_requires', 'release_time', 'contact'],
              header=0)
              # 为数据指定列标签,同时不读取数据的首行
df.head()
# df.info()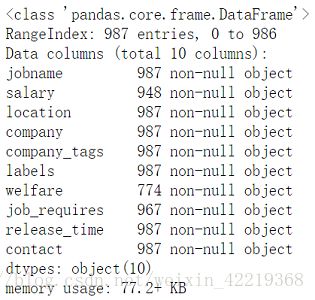
Error01:OSError: Initializing from file failed :
Error02:UnicodeDecodeError: ‘gbk’ codec can’t decode byte 0x80 in position 109: illegal multibyte sequence:
以上两个报错,第一个报错原因是文件名有中文,第二个报错是因为文件内容编码问题,都可以通过open()方法解决,在使用open()的同时指定编码格式
2.1.2 数据查重及重复行删除
df.duplicated().value_counts() # 数据查重,结果出现6条重复值
>>  False    981
    True       6
    dtype: int64
df_new = df.drop_duplicates(['jobname', 'salary', 'location', 'company', 'company_tags', 'labels', 'welfare'],'first')  # 删除重复行
df_new.duplicated().value_counts()  # 对新数据进行查重
>>  False    979
    dtype: int64
2.2 数据清洗及分析
2.2.1 原始数据结构查看
2.2.2 company_tags数据处理分析
2.2.2.1 company_tags清洗
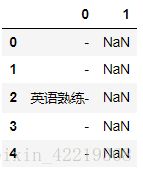
company_tags_split=df_new['company_tags'].str.split('|').apply(pd.Series)
company_tags_split[0]=company_tags_split[0].str.replace('\t','')
company_tags_split[1]=company_tags_split[1].str.replace('\t','')
company_tags_split.columns=['company_attr','company_size','company_field']
company_field_split=company_tags_split['company_field'].str.split(',').apply(pd.Series)
company_field_split.head()
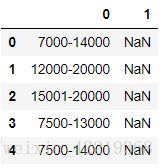
campany_tags_new=pd.concat([company_tags_split['company_attr'],company_tags_split['company_size'],company_field_split[0],company_field_split[1]],axis=1)
campany_tags_new.columns=[0,1,2,3]
campany_tags_new.head(2)
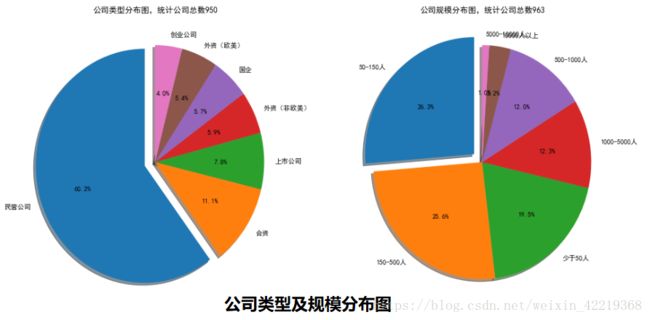
2.2.2.2 对公司的性质及大小进行统计分析
comp_attr_count=campany_tags_new[0].value_counts().head(7)  # 取前七个
comp_size_count=campany_tags_new[1].value_counts().head(7)  # 取前七个

comp_attr_num=list(comp_attr_count.values)
comp_attr_sum=sum(comp_attr_num)

comp_attr=list(comp_attr_count.index)

comp_attr_new=[]
for i in comp_attr:
    comp_attr_new.append(i[0:7].strip())

comp_size_num=list(comp_size_count.values)
comp_size_sum=sum(comp_size_num)
comp_size=list(comp_size_count.index)

comp_size_new=[]
for i in comp_size:
    comp_size_new.append(i[2:15].strip())
2.2.2.3 分析结果图表展示
fig=plt.figure(figsize=(16,8))
plt.subplot(121)
plt.pie(comp_attr_num,
       labels=comp_attr_new,
       startangle=90,  # 指定图形的起始角度
       shadow=True,
       explode=(0.1,0,0,0,0,0,0),  # 指定块突出显示
       autopct='%1.1f%%')
plt.title('公司类型分布图,统计公司总数'+str(comp_attr_sum))

plt.subplot(122)
plt.pie(comp_size_num,
       labels=comp_size_new,
       startangle=90,  # 指定图形的起始角度
       shadow=True,
       explode=(0.1,0,0,0,0,0,0),  # 指定块突出显示
       autopct='%1.1f%%')
plt.title('公司规模分布图,统计公司总数'+str(comp_size_sum))

plt.show()![]()
2.2.3 welfare 数据处理分析
2.2.3.1 welfare 数据拆分
welfare_split=df_new['welfare'].str.split('#').apply(pd.Series)
welfare_split.columns=['welfare_split_1','welfare_split_2','welfare_split_3','welfare_split_4','welfare_split_5','welfare_split_6','welfare_split_7','welfare_split_8','welfare_split_9','welfare_split_10','welfare_split_11']
welfare_split.head(2)
2.2.3.2 welfare 数据合并分析
welf=welfare_split.apply(pd.value_counts)
# 利用unstack()函数做行列转换,同时删除NaN值,
welf=welf.unstack().dropna().reset_index()  # 结果为DataFrame数据
welf.head()
2.2.3.3 welfare 数据合并后数据处理
welf.columns=['level_0','level_1','counts']
welf_new=welf.drop(['level_0'],axis=1).groupby('level_1').sum()
welf_top10=welf_new.sort_values('counts',ascending=False).head(11)
welf_top10=welf_top10.reset_index()
welf_top10=welf_top10.drop(labels=0,axis=0,inplace=False)
welf_top10.set_index(["level_1"], inplace=True)
2.2.3.4 welfare 数据合并后分析结果可视化展示
welf_top10.sort_values(by='counts',ascending=False).plot(kind='bar',figsize=(12,6))
plt.show()
2.2.4 labels 数据处理分析
2.2.4.1 labels 数据清洗
# labels数据清洗,第一步:去除末尾的#
df_new['labels']=df_new['labels'].str.replace('#######','')
df_new['labels']=df_new['labels'].str.replace('######','')
df_new['labels']=df_new['labels'].str.replace('#####','')
df_new['labels']=df_new['labels'].str.replace('####','')
df_new['labels']=df_new['labels'].str.replace('###','')
df_new['labels']=df_new['labels'].str.replace('##','')

df_new['labels'].head(3)
2.2.4.2 labels 数据拆分 – 拆分出学历与工作经验
# 筛选出学历与工作经验
df_new['labels']=df_new['labels'].str.replace('人','人#')
e_split=df_new['labels'].str.split('#').apply(pd.Series)
e_split.head(2)
2.2.4.3 labels 数据拆分 – 学历与工作经验拆分
# 将学历与工作经验分开
e_split[1]=e_split[1].str.replace('无','#无')
e_split[1]=e_split[1].str.replace('1','#1')
e_split[1]=e_split[1].str.replace('2','#2')
e_split[1]=e_split[1].str.replace('3','#3')
e_split[1]=e_split[1].str.replace('4','#4')
e_split[1]=e_split[1].str.replace('5','#5')
e_split[1]=e_split[1].str.replace('6','#6')
e_split[1]=e_split[1].str.replace('7','#7')
e_split[1]=e_split[1].str.replace('8','#8')
e_split[1]=e_split[1].str.replace('9','#9')
e_split[1]=e_split[1].str.replace('10','#10')
e_split[1]=e_split[1].str.replace('-#','-')  # 3-4年,经过上一步变换,#3-#4
e_split[1]=e_split[1].str.replace('##','#')  # 将部分地方多余的 # 变换一下
e_split_new=e_split[1].str.split('#').apply(pd.Series)
e_split_new.head()
2.2.4.3 labels 数据拆分 – 在de_new中新增加学历与工作经验两列数据
df_new['edu']=e_split_new[0]
df_new['experience']=e_split_new[1]
2.2.5 salary 数据处理
2.2.5.1 salary 数据清洗-1
salary_split=df['salary'].str.split('/').apply(pd.Series)
salary_split_0=salary_split[0].str.split('-').apply(pd.Series)
salary_split_1 = pd.concat([salary_split_0,salary_split[1]],axis=1)
salary_split_1.columns=[0,1,2]

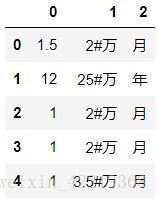
salary_split_1[1] = salary_split_1[1].str.replace('万','#万')
salary_split_1[1] = salary_split_1[1].str.replace('千','#千')
salary_split_1.head()
2.2.5.2 salary 数据清洗-2
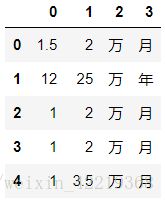
salary_split_1_split=salary_split_1[1].str.split('#').apply(pd.Series)
salary_split_1_split.head()
salary_split_2 = pd.concat([salary_split_1[0],salary_split_1_split[0],salary_split_1_split[1],salary_split_1[2]],axis=1)
salary_split_2.columns=[0,1,2,3]
salary_split_2[0] = salary_split_2[0].str.replace('元','0000000')
salary_split_2[0] = salary_split_2[0].str.replace('万以上','0000000')
for i in range(len(salary_split_2[0])):
    if salary_split_2[0][i]=='1.5千以下':
        salary_split_2[0][i]=0
salary_split_2[0] = salary_split_2[0].astype(float)
salary_split_2[1] = salary_split_2[1].astype(float)
salary_split_2.head()
2.2.5.3 salary 数据清洗-3:将salary的上下限单位变为元
for i in range(len(salary_split_2[0])):
    if salary_split_2[0][i]>1000:
        salary_split_2[0][i]=0
        salary_split_2[1][i]=0
    elif salary_split_2[2][i]=='万':
        salary_split_2[0][i] = salary_split_2[0][i] *10000
        salary_split_2[1][i] = salary_split_2[1][i] *10000
    elif salary_split_2[2][i]=='千':
        salary_split_2[0][i] = salary_split_2[0][i] *1000
        salary_split_2[1][i] = salary_split_2[1][i] *1000

salary_split_2.head()
2.2.5.4 salary 数据清洗-3:将salary的年工资变为月工资
for i in range(len(salary_split_2[0])):
    if salary_split_2[3][i]=='年':
        salary_split_2[0][i] = salary_split_2[0][i] / 12
        salary_split_2[1][i] = salary_split_2[1][i] / 12
salary_split_2.head()
2.2.5.5 在原数据df_new中增加一列:工资的平均值-salary_mean
df_new['salary_mean']=(salary_split_2[0] +salary_split_2[0])/22.2.5.6 查看df_new[‘salary_mean’]并处理极端值
df_new['salary_mean'].sort_values(ascending=False).head(1) # 发现极端值40W
>>  88    400000.0
    Name: salary_mean, dtype: float64

df_new['salary_mean'][88]=np.nan  # 转为nan值
df_new['salary_mean'].sort_values(ascending=False).head()
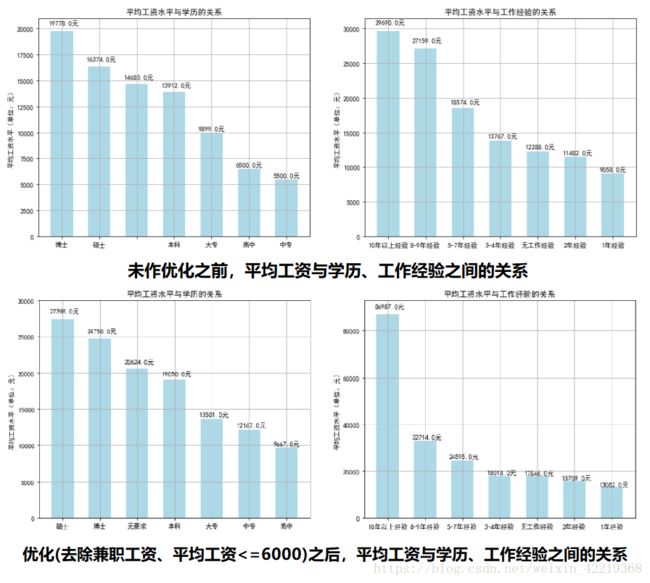
2.2.6 探查工资平均水平与学历、工作经验的关系
2.2.6.1 将工资数据按照学历、工作经验分组后求平均值
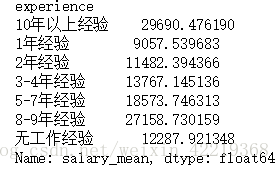
sal_edu_mean=df_new.groupby(['edu'])['salary_mean'].mean()
sal_exp_mean=df_new.groupby(['experience'])['salary_mean'].mean()
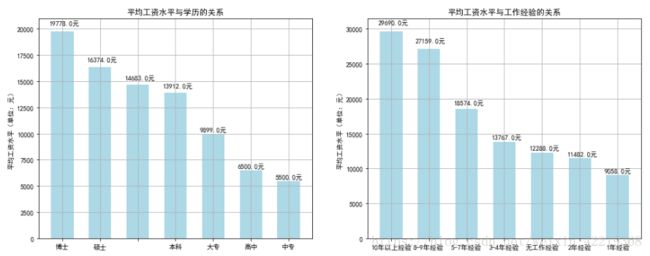
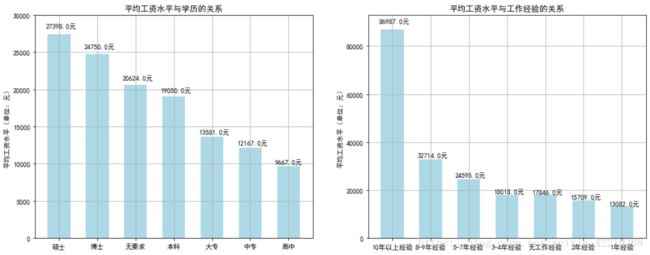
2.2.6.2 分析结果图表展示
fig=plt.figure(figsize=(16,6))

ax1=plt.subplot(121)
data=np.round(sal_edu_mean.sort_values(ascending=False).values) # 7个等级

x_bar=np.arange(7)
# 核心图形绘制
# rect=ax1.bar(left=x_bar,height=data,width=0.5,color='lightblue')
#The *left* kwarg to `bar` is deprecated use *x* instead. Support for *left* will be removed in Matplotlib 3.0

rect=ax1.bar(x=x_bar,height=data,width=0.6,color='lightblue')

# 向各条形上添加数据标签
for rec in rect:
    x=rec.get_x()
    height=rec.get_height()
    ax1.text(x-0.05,1.03*height,str(height)+'元')

# 绘制x,y坐标轴刻度及标签,标题
ax1.set_xticks(x_bar)
ax1.set_xticklabels(tuple(sal_edu_mean.sort_values(ascending=False).index))
ax1.set_ylabel('平均工资水平(单位:元)')
ax1.set_title('平均工资水平与学历的关系')
ax1.grid(True)
ax1.set_ylim(0,21000)

ax1=plt.subplot(122)
data=np.round(sal_exp_mean.sort_values(ascending=False).values) # 7个等级

x_bar=np.arange(7)
# 核心图形绘制
# rect=ax1.bar(left=x_bar,height=data,width=0.5,color='lightblue')
#The *left* kwarg to `bar` is deprecated use *x* instead. Support for *left* will be removed in Matplotlib 3.0

rect=ax1.bar(x=x_bar,height=data,width=0.6,color='lightblue')

# 向各条形上添加数据标签
for rec in rect:
    x=rec.get_x()
    height=rec.get_height()
    ax1.text(x-0.05,1.03*height,str(height)+'元')

# 绘制x,y坐标轴刻度及标签,标题
ax1.set_xticks(x_bar)
ax1.set_xticklabels(tuple(sal_exp_mean.sort_values(ascending=False).index))
ax1.set_ylabel('平均工资水平(单位:元)')
ax1.set_title('平均工资水平与工作经验的关系')
ax1.grid(True)
ax1.set_ylim(0,31500)
2.2.7 各公司对英语的要求
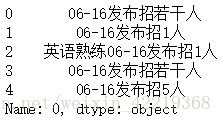
2.2.7.1 查看一下含英语标签
e_split[0].head()2.2.7.2 标签拆分
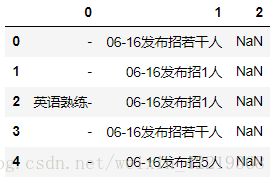
skill_split=e_split[0].str.replace('05','-05')
skill_split=skill_split.str.replace('06','-06')
skill_split=skill_split.str.replace('05','#05')
skill_split=skill_split.str.replace('06','#06')
skill_split_new=skill_split.str.split('#').apply(pd.Series)
skill_split_new.head()skill_split_new[0]=skill_split_new[0].str.replace('04','-#04')
skill_split_new[0]=skill_split_new[0].str.replace('03','-#03')
skill_split_new[0]=skill_split_new[0].str.replace('02','-#02')
skill_split_new1=skill_split_new[0].str.split('#').apply(pd.Series)
skill_split_new1.head()eng_skill=skill_split_new1[0].str.replace('#','')
eng_skill=skill_split_new1[0].str.replace('英语','#英语')
eng_skill=eng_skill.str.split('#').apply(pd.Series)
eng_skill[1].value_counts()english_require=eng_skill[1].str.replace('英语熟练-','英语熟练+')
english_require=english_require.str.replace('英语良好-','英语熟练+')
english_require=english_require.str.replace('英语精通-','英语熟练+')
english_require=english_require.str.replace('英语熟练 普通话熟练-','英语熟练+')
english_require=english_require.str.replace('英语精通 普通话精通-','英语熟练+')
english_require=english_require.str.replace('英语良好','英语熟练+')
english_require=english_require.str.replace('英语良好 日语一般-','英语熟练+')
english_require=english_require.str.replace('英语精通 普通话良好-','英语熟练+')
english_require=english_require.str.replace('英语-','英语')
english_require=english_require.str.replace('英语一般-','英语')
english_require=english_require.str.replace('英语 德语','英语')
df_new['english_requires']=english_require
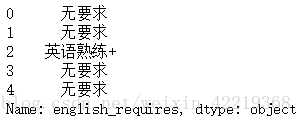
df_new['english_requires']=df_new['english_requires'].fillna('无要求')
df_new['english_requires'].head()df_new['english_requires']=df_new['english_requires'].str.strip()
df_new['english_requires']=df_new['english_requires'].str.replace('英语熟练+ 日语一般-','英语熟练+')
eng_sk=df_new['english_requires'].str.replace('要求','要求#')
eng_sk=eng_sk.str.replace('熟练+','熟练+#')
eng_sk=eng_sk.str.replace('英语','英语#')
eng_sk=eng_sk.str.replace('英语#熟练','英语熟练')
eng_sk=eng_sk.str.split('#').apply(pd.Series)
df_new['english_requires']=eng_sk[0]
english_count=df_new['english_requires'].value_counts()
english_count2.2.7.2 英语需求统计分析结果图表展示
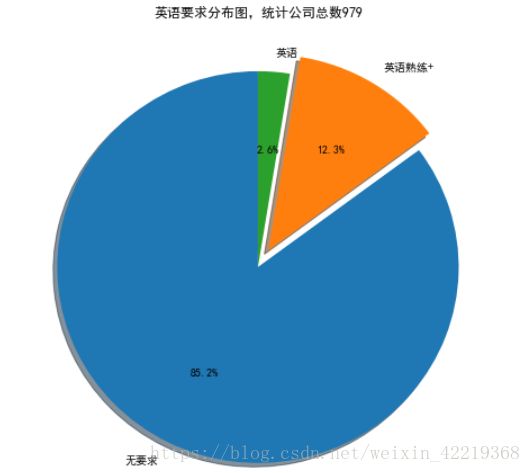
fig=plt.figure(figsize=(8,8))
plt.subplot(111)
plt.pie(list(english_count.values),
       labels=list(english_count.index),
       startangle=90,  # 指定图形的起始角度
       shadow=True,
       explode=(0,0.1,0),  # 指定块突出显示
       autopct='%1.1f%%')
plt.title('英语要求分布图,统计公司总数'+str(sum(list(english_count.values))))
2.2.8 job_requires文本内容关键词提取分析
2.2.8.1 通过第三方模块jieba进行关键词提取
# 由于jupyter notebook导入模块出现问题,所以此处代码通过pycharm实现
import pandas as pd
import jieba
from collections import Counter     #导入collections模块的Counter类

ai_file=open('51job职位信息 -- 人工智能_20.csv','r',encoding='utf-8')
df=pd.read_csv(ai_file,
               names=['jobname', 'salary', 'location', 'company', 'company_tags', 'labels', 'welfare','job_requires', 'release_time', 'contact'],
               header=0)
requires=list(df['job_requires'])
requires_text=''
for require in requires:
    requires_text=requires_text+str(require).replace('#','')

keywords=[]
word_freq=[]
def get_words(txt):
    list = jieba.cut(txt)   #结巴模块的cut函数用于中文分词
    c = Counter()   #创建空的Counter计数器
    for x in list:  #分词结果中循环提取词语
        if len(x) > 1 and x != '\r\n':  #略掉只有一个字的词语和回车、换行
            c[x] += 1   #统计每个单词的计数值
    for(k,v) in c.most_common(1000):     #只取出现值最高的前100个词语
        keywords.append(k)
        word_freq.append(v)
get_words(requires_text)
for i in range(len(keywords_l)):
    word_freq_l.append(word_freq[keywords.index(keywords_l[i])])
print(word_freq_l)
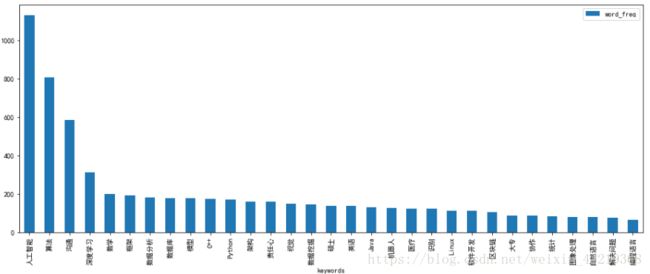
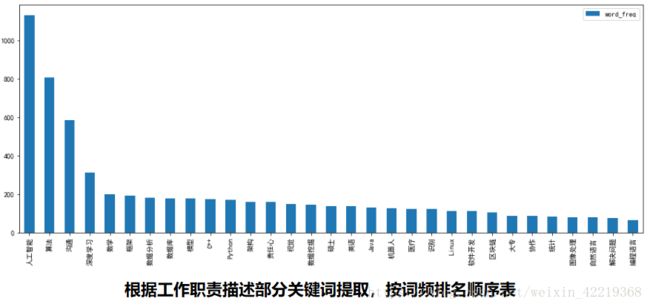
# 由于没有使用自定义词典所以导致在分词时出现太多普通词汇,此处通过jieba筛选出前1000个高频词后,在进行手工筛选与领域相关的关键词,主要如下:
keywords_l=['能力', '人工智能', '算法',  '沟通', '深度',  '解决问题', '数学', '编程语言', '框架',  '数据分析', 'AI', '数据库', '模型',  'C++', 'Python', '架构', '责任心',  '视觉',  '数据挖掘',  '硕士', '英语',  'Java', '机器人', '识别', '医疗',  'Linux', '软件开发', '区块', '大专',  '协作', '统计',  '图像处理', '自然语言', '解决问题',  '全日制',  '抗压', '神经网络', '表达能力',  '编程语言', '前沿', 'python',  '统计学', '推荐',  'SQL', '确保', 'Hadoop', '架构设计', '计算机相关', '数据处理',  'PatSnap', 'Spark', '分布式', '传感器', '英文',  '本科', '清洗', '博士', 'Caffe', '海外', '研究生',  '认真','软件工程', '计算机科学',   '责任感', '嵌入式', '研究员', 'Oracle', 'ERP', '模式识别','PPT',  'TensorFlow',  'java', '聚类',  'SVM',  '数据结构',  'CRM', 'linux', '决策树',  'JAVA',  '表达', '人脸识别', '大学本科', 'Tensorflow',  'Matlab',  '普通话', '贝叶斯', 'spark', 'Redis',  'MySQL', 'NLP', '基础知识','语言表达', 'Keras', '211', 'Theano', 'Torch', '面向对象', 'Spring', 'js', '实战经验',  '团队精神','创新能力', '英语口语', '认真负责', 'Windows', '可视化', '钻研', '985', '自学能力']
# 与筛选关键词对应的词频
word_freq_l=[1546, 1130, 807, 586, 311, 77, 200, 65, 193, 181, 180, 179, 179, 174, 171, 160, 158, 149, 143, 137, 137, 131, 125, 122, 122, 112, 111, 104, 88, 86, 84, 80, 79, 77, 76, 72, 70, 67, 65, 65, 63, 60, 60, 60, 60, 58, 57, 55, 55, 54, 49, 48, 48, 47, 281, 45, 42, 41, 38, 38, 37, 35, 35, 35, 35, 34, 33, 33, 33, 32, 32, 31, 31, 30, 30, 30, 29, 28, 28, 28, 27, 27, 26, 25, 24, 24, 24, 24, 24, 24, 24, 21, 21, 21, 21, 21, 21, 21, 20, 19, 19, 19, 19, 18, 18, 18, 18, 18, 18]
2.2.8.2 对提取的关键词进行清洗
word_freq_df=pd.DataFrame({'keywords':keywords_l,'word_freq':word_freq_l})
word_freq_df=word_freq_df.drop(labels=0,axis=0,inplace=False)  # 除去第一行的关键词‘能力’,范围太广
# 关键词替换,将"深度"-->"深度学习","区块"-->"区块链",同时删除“AI”关键词
word_freq_df['keywords'][23]='深度学习'
word_freq_df['keywords'][24]='区块链'
word_freq_df = word_freq_df.drop(labels=10,axis=0,inplace=False)
# 取前31个词频最高的关键词
word_freq_df_top31=word_freq_df.reset_index(drop=True).head(31)
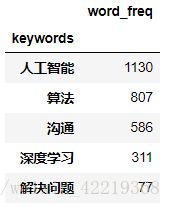
word_freq_df_top31.set_index(["keywords"], inplace=True)
word_freq_df_top31.head(5)
2.2.8.3 关键词词频分析图表展示
word_freq_df_top31.sort_values(by='word_freq',ascending=False).plot(kind='bar',figsize=(16,6))
plt.show()
2.2.9 salary优化处理
2.2.9.1 数据清洗
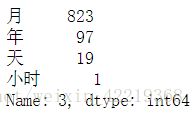
#对数据进行重新清洗,将其中出现兼职(以天/小时计薪)及工资范围最大值小于等于6000的工资以nap.nan处理,在计算均值时不做处理
salary_split=df_new['salary'].str.split('/').apply(pd.Series)
salary_split_0=salary_split[0].str.split('-').apply(pd.Series)
salary_split_1 = pd.concat([salary_split_0,salary_split[1]],axis=1)
salary_split_1.columns=[0,1,2]
salary_split_1[1] = salary_split_1[1].str.replace('万','#万')
salary_split_1[1] = salary_split_1[1].str.replace('千','#千')
salary_split_1.head()salary_split_1_split=salary_split_1[1].str.split('#').apply(pd.Series)
salary_split_2 = pd.concat([salary_split_1[0],salary_split_1_split[0],salary_split_1_split[1],salary_split_1[2]],axis=1)
salary_split_2.columns=[0,1,2,3]
salary_split_2.head()
# 处理极端值
salary_split_2[0].value_counts().sort_index()
salary_split_min_pre=salary_split_2[0].str.strip().replace('1.5千以下','0')
salary_split_min_pre=salary_split_min_pre.str.strip().replace('1000元','0')
salary_split_min_pre=salary_split_min_pre.str.strip().replace('100万以上','0')
salary_split_min_pre=salary_split_min_pre.str.strip().replace('100元','0')
salary_split_min_pre=salary_split_min_pre.str.strip().replace('10万以上','100000')
salary_split_min_pre=salary_split_min_pre.str.strip().replace('120元','0')
salary_split_min_pre=salary_split_min_pre.str.strip().replace('150元','0')
salary_split_min_pre=salary_split_min_pre.str.strip().replace('1600元','0')
salary_split_min_pre=salary_split_min_pre.str.strip().replace('175元','0')
salary_split_min_pre=salary_split_min_pre.str.strip().replace('200元','0')
salary_split_min_pre=salary_split_min_pre.str.strip().replace('250元','0')
salary_split_min_pre=salary_split_min_pre.str.strip().replace('300元','0')
salary_split_min_pre=salary_split_min_pre.str.strip().replace('60元','0')
salary_split_min_pre=salary_split_min_pre.str.strip().replace('80元','0')
salary_split_2[0]=salary_split_min_pre
salary_split_2.head()salary_split_3=salary_split_2
salary_split_3[0] = salary_split_3[0].astype(float)
salary_split_3[1] = salary_split_3[1].astype(float)
salary_split_max_1=salary_split_3[1].loc[salary_split_3[2] == '千']*1000
salary_split_max_2=salary_split_3[1].loc[salary_split_3[2] == '万']*10000
salary_split_max=pd.concat([salary_split_max_1,salary_split_max_2],axis=0)
salary_split_max=salary_split_max.sort_index()
salary_split_min_1=salary_split_3[0].loc[salary_split_3[2] == '千']*1000
salary_split_min_2=salary_split_3[0].loc[salary_split_3[2] == '万']*10000
salary_split_min=pd.concat([salary_split_min_1,salary_split_min_2],axis=0)
salary_split_min=salary_split_min.sort_index()
salary_split_3[0]=salary_split_min
salary_split_3[1]=salary_split_max
salary_split_3.head()salary_split_3[3].value_counts()salary_split_min_new=pd.concat([salary_split_3[0].loc[salary_split_3[3] == '天'].apply(pd.Series),
salary_split_3[0].loc[salary_split_3[3] == '小时'].apply(pd.Series),
(salary_split_3[0].loc[salary_split_3[3] == '年']/12.0).apply(pd.Series),
salary_split_3[0].loc[salary_split_3[3] == '月'].apply(pd.Series)],
axis=0).sort_index()
salary_split_max_new=pd.concat([salary_split_3[1].loc[salary_split_3[3] == '天'].apply(pd.Series),
salary_split_3[1].loc[salary_split_3[3] == '小时'].apply(pd.Series),
(salary_split_3[1].loc[salary_split_3[3] == '年']/12.0).apply(pd.Series),
salary_split_3[1].loc[salary_split_3[3] == '月'].apply(pd.Series)],
axis=0).sort_index()
salary_split_min_new.head()salary_split_min_new[0].loc[salary_split_min_new[0] == 0]=np.nan
salary_split_max_new[0].loc[salary_split_max_new[0] == 0]=np.nan
df_new_save['salary_min']=salary_split_min_new[0]
df_new_save['salary_max']=salary_split_max_new[0]
salary_min=df['salary_min']
salary_max=df['salary_max']
salary_min.loc[salary_max <= 6000]=np.nan
salary_max.loc[salary_max <= 6000]=np.nan
salary_max.head(10)
df['salary_mean']=(salary_min+ salary_max ) / 22.2.9.2 分析结果图表展示
sal_edu_mean=df.groupby(['edu'])['salary_mean'].mean()
sal_exp_mean=df.groupby(['experience'])['salary_mean'].mean()

fig=plt.figure(figsize=(16,6))

ax1=plt.subplot(121)
data=np.round(sal_edu_mean.sort_values(ascending=False).values) # 7个等级

x_bar=np.arange(7)
# 核心图形绘制
# rect=ax1.bar(left=x_bar,height=data,width=0.5,color='lightblue')
#The *left* kwarg to `bar` is deprecated use *x* instead. Support for *left* will be removed in Matplotlib 3.0

rect=ax1.bar(x=x_bar,height=data,width=0.6,color='lightblue')

# 向各条形上添加数据标签
for rec in rect:
    x=rec.get_x()
    height=rec.get_height()
    ax1.text(x-0.05,1.03*height,str(height)+'元')

# 绘制x,y坐标轴刻度及标签,标题
ax1.set_xticks(x_bar)
ax1.set_xticklabels(tuple(sal_edu_mean.sort_values(ascending=False).index))
ax1.set_ylabel('平均工资水平(单位:元)')
ax1.set_title('平均工资水平与学历的关系')
ax1.grid(True)
ax1.set_ylim(0,30000)

ax1=plt.subplot(122)
data=np.round(sal_exp_mean.sort_values(ascending=False).values) # 7个等级

x_bar=np.arange(7)
# 核心图形绘制
# rect=ax1.bar(left=x_bar,height=data,width=0.5,color='lightblue')
#The *left* kwarg to `bar` is deprecated use *x* instead. Support for *left* will be removed in Matplotlib 3.0

rect=ax1.bar(x=x_bar,height=data,width=0.6,color='lightblue')

# 向各条形上添加数据标签
for rec in rect:
    x=rec.get_x()
    height=rec.get_height()
    ax1.text(x-0.05,1.03*height,str(height)+'元')

# 绘制x,y坐标轴刻度及标签,标题
ax1.set_xticks(x_bar)
ax1.set_xticklabels(tuple(sal_exp_mean.sort_values(ascending=False).index))
ax1.set_ylabel('平均工资水平(单位:元)')
ax1.set_title('平均工资水平与工作经验的关系')
ax1.grid(True)
ax1.set_ylim(0,93000)
3 智联招聘网站数据分析
3.1 数据探索
3.1.1 分别导入各地数据,并合并数据
import numpy as np
import pandas as pd


# OSError: Initializing from file failed : 文件名有中文时,会报错

# 数据内出现编码问题,在open()时指定编码,UnicodeDecodeError: 'gbk' codec can't decode byte 0x80 in position 109: illegal multibyte sequence

ai_file_b=open('./02-zlzp/智联招聘 - 人工智能-北京_5.csv','r',encoding='utf-8')
ai_file_sh=open('./02-zlzp/智联招聘 - 人工智能-上海_5.csv','r',encoding='utf-8')
ai_file_g=open('./02-zlzp/智联招聘 - 人工智能-广州_5.csv','r',encoding='utf-8')
ai_file_sz=open('./02-zlzp/智联招聘 - 人工智能-深圳_5.csv','r',encoding='utf-8')
df_b=pd.read_csv(ai_file_b,
              names=['count','jobname','salary','campany','welfares','location','release_time','work_time',
                       'experience','back_edu','num_need','job_kind'],
               index_col='count',
               header=0)
df_sh=pd.read_csv(ai_file_sh,
              names=['count','jobname','salary','campany','welfares','location','release_time','work_time',
                       'experience','back_edu','num_need','job_kind'],
                   index_col='count',
               header=0)
df_g=pd.read_csv(ai_file_g,
              names=['count','jobname','salary','campany','welfares','location','release_time','work_time',
                       'experience','back_edu','num_need','job_kind'],
                  index_col='count',
               header=0)
df_sz=pd.read_csv(ai_file_sz,
              names=['count','jobname','salary','campany','welfares','location','release_time','work_time',
                       'experience','back_edu','num_need','job_kind'],
                   index_col='count',
               header=0)
df=df_b.append(df_sh,ignore_index=True)
df=df.append(df_g,ignore_index=True)
df=df.append(df_sz,ignore_index=True)
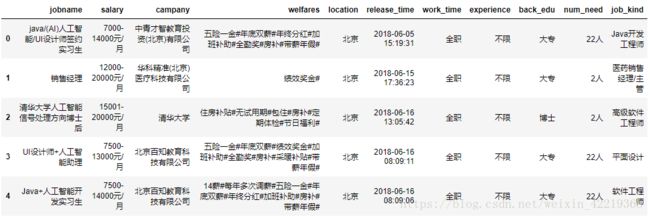
df.head()
3.1.2 数据查重及删除重复行
df.duplicated().value_counts() # 对返回结果进行计数df_new = df.drop_duplicates(['jobname', 'salary', 'campany', 'welfares', 'location', 'work_time', 'experience'],'first') # 删除重复行
df_new.duplicated().value_counts() # 对新数据进行查重3.2 welfare数据清洗
3.2.1 welfare 按照地区拆分清洗
3.2.1.1 北京地区数据重复值处理
df_b.duplicated().value_counts()  # 对北京地区数据进行查重
df_b_new=df_b.drop_duplicates(['jobname', 'salary', 'campany', 'welfares', 'location', 'work_time', 'experience'],'first')  # 删除重复行
3.2.1.2 北京地区数据重复值处理-1
welfare_split_b=df_b_new['welfares'].str.split('#').apply(pd.Series)
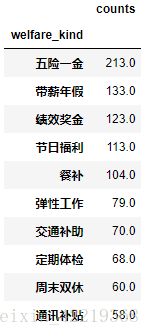
welf_b=welfare_split_b.apply(pd.value_counts)
welf_b=welf_b.unstack().dropna().reset_index()
welf_b.columns=['level_0','welfare_kind','counts']
welf_b_n=welf_b.drop(['level_0'],axis=1).groupby(['welfare_kind']).sum()
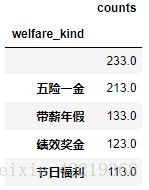
welf_b_n.sort_values('counts',ascending=False).head()
3.2.1.3 北京地区数据重复值处理-2:取前10个关键词
welf_b_top10=welf_b_n.sort_values('counts',ascending=False).head(11)
welf_b_top10=welf_b_top10.reset_index()
welf_b_top10=welf_b_top10.drop(labels=0,axis=0,inplace=False)
welf_b_top10.set_index(["welfare_kind"], inplace=True)
3.2.2 其他地区处理方式同北京地区数据
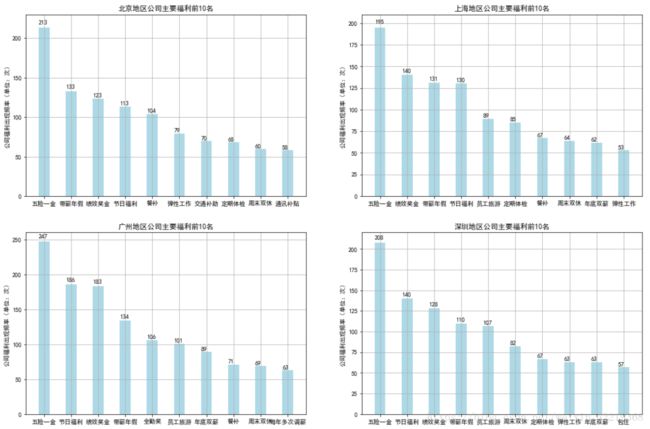
3.2.3 welfare数据按地区处理结果图表展示
import matplotlib.pyplot as plt
plt.rcParams["font.sans-serif"]=['SimHei']  # 用于正常显示中文标签
plt.rcParams['axes.unicode_minus']=False  # 用来正常显示负号
fig=plt.figure(figsize=(18,12))

ax1=plt.subplot(221)
data=welf_b_top10['counts'].values.astype(int) # 10个等级

x_bar=np.arange(10)

rect=ax1.bar(x=x_bar,height=data,width=0.4,color='lightblue')

# 向各条形上添加数据标签
for rec in rect:
    x=rec.get_x()
    height=rec.get_height()
    ax1.text(x,1.02*height,str(height))

# 绘制x,y坐标轴刻度及标签,标题
ax1.set_xticks(x_bar)
ax1.set_xticklabels(tuple(welf_b_top10['counts'].index))
ax1.set_ylabel('公司福利出现频率(单位:次)')
ax1.set_title('北京地区公司主要福利前10名')
ax1.grid(True)
ax1.set_ylim(0,230)

ax2=plt.subplot(222)
data=welf_sh_top10['counts'].values.astype(int) # 10个等级

x_bar=np.arange(10)

rect=ax2.bar(x=x_bar,height=data,width=0.4,color='lightblue')

# 向各条形上添加数据标签
for rec in rect:
    x=rec.get_x()
    height=rec.get_height()
    ax2.text(x,1.02*height,str(height))

# 绘制x,y坐标轴刻度及标签,标题
ax2.set_xticks(x_bar)
ax2.set_xticklabels(tuple(welf_sh_top10['counts'].index))
ax2.set_ylabel('公司福利出现频率(单位:次)')
ax2.set_title('上海地区公司主要福利前10名')
ax2.grid(True)
ax2.set_ylim(0,210)


ax3=plt.subplot(223)
data=welf_g_top10['counts'].values.astype(int) # 10个等级

x_bar=np.arange(10)

rect=ax3.bar(x=x_bar,height=data,width=0.4,color='lightblue')

# 向各条形上添加数据标签
for rec in rect:
    x=rec.get_x()
    height=rec.get_height()
    ax3.text(x,1.02*height,str(height))

# 绘制x,y坐标轴刻度及标签,标题
ax3.set_xticks(x_bar)
ax3.set_xticklabels(tuple(welf_g_top10['counts'].index))
ax3.set_ylabel('公司福利出现频率(单位:次)')
ax3.set_title('广州地区公司主要福利前10名')
ax3.grid(True)
ax3.set_ylim(0,260)

ax4=plt.subplot(224)
data=welf_sz_top10['counts'].values.astype(int) # 10个等级

x_bar=np.arange(10)

rect=ax4.bar(x=x_bar,height=data,width=0.4,color='lightblue')

# 向各条形上添加数据标签
for rec in rect:
    x=rec.get_x()
    height=rec.get_height()
    ax4.text(x,1.02*height,str(height))

# 绘制x,y坐标轴刻度及标签,标题
ax4.set_xticks(x_bar)
ax4.set_xticklabels(tuple(welf_sz_top10['counts'].index))
ax4.set_ylabel('公司福利出现频率(单位:次)')
ax4.set_title('深圳地区公司主要福利前10名')
ax4.grid(True)
ax4.set_ylim(0,220)
3.3 salary 数据清洗
3.3.1 salary 数据拆分清洗-1
salary_split=df_new['salary'].str.split('/').apply(pd.Series)
salary_split_1 = salary_split[0].str.split('元').apply(pd.Series)
# 处理乱码值:4001-6000å…ƒ      1
salary_split_1[0]=salary_split_1[0].str.replace('6000','6000#')
salary_split_1[0]=salary_split_1[0].str.replace('6000#0','60000')  # 预防有60000的薪资出现
salary_split_1[0]=salary_split_1[0].str.replace('6000#-','6000-')  # 6000作为范围值的初始值时
salary_split_2=salary_split_1[0].str.split('#').apply(pd.Series)
salary_split_2.head()
3.3.2 salary 数据拆分清洗-1将‘面议’及对工资低于‘6000’的值进行过滤
salary_split_new=salary_split_2[0].str.split('-').apply(pd.Series)
salary_split_new[0]=salary_split_new[0].str.strip()
salary_split_new[0]
salary_split_min=salary_split_new[0]
salary_split_min.loc[salary_split_min == "面议"]='0'
salary_split_min=salary_split_min.astype(int)
salary_split_min.loc[salary_split_min == 0]= np.nan
# 将最大值最小值小于6000的数值均设为nan,不做统计
salary_split_min.loc[salary_split_min < 6000]= np.nan
salary_split_max.loc[salary_split_max < 6000]= np.nan
3.3.3 df_new增加一列新的数据salary_mean
# 添加一列新的值,其中工资低于6000的以及“面议”的工资不做处理
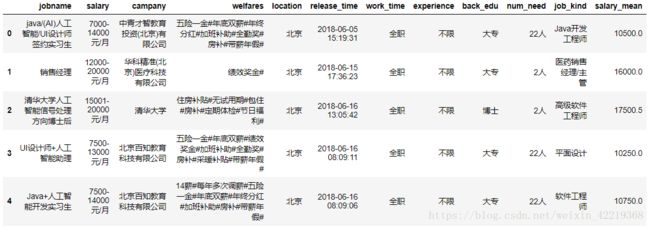
df_new['salary_mean'] = ( salary_split_max + salary_split_min )/2
df_new.head()
3.4 平均工资与学历、工作经验的关系
3.4.1 将工资按照学历、工作经验分类后求均值
3.4.1.1 工资与学历的关系
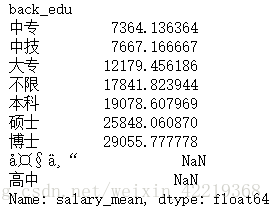
sal_edu_mean=df_new.groupby(['back_edu'])['salary_mean'].mean()
sal_edu_mean.sort_values()
3.4.1.2 工资与工作经验的关系
sal_exp_mean=df_new.groupby(['experience'])['salary_mean'].mean()
sal_exp_mean.sort_values()
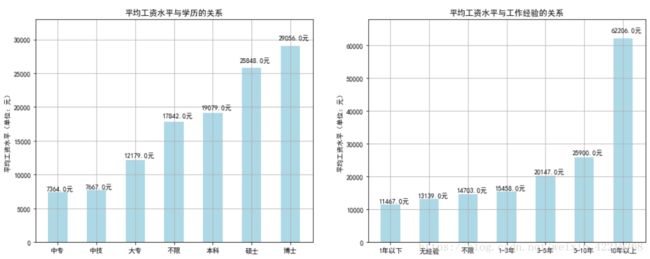
3.4.2 工资水平与学历、工作经验分析结果图表展示
fig=plt.figure(figsize=(16,6))

ax1=plt.subplot(121)
data=np.round(sal_edu_mean.sort_values().head(7).values) # 7个等级

x_bar=np.arange(7)
# 核心图形绘制
# rect=ax1.bar(left=x_bar,height=data,width=0.5,color='lightblue')
#The *left* kwarg to `bar` is deprecated use *x* instead. Support for *left* will be removed in Matplotlib 3.0

rect=ax1.bar(x=x_bar,height=data,width=0.5,color='lightblue')

# 向各条形上添加数据标签
for rec in rect:
    x=rec.get_x()
    height=rec.get_height()
    ax1.text(x-0.05,1.03*height,str(height)+'元')

# 绘制x,y坐标轴刻度及标签,标题
ax1.set_xticks(x_bar)
ax1.set_xticklabels(tuple(sal_edu_mean.sort_values().head(7).index))
ax1.set_ylabel('平均工资水平(单位:元)')
ax1.set_title('平均工资水平与学历的关系')
ax1.grid(True)
ax1.set_ylim(0,33000)


ax2=plt.subplot(122)
data2=np.round(sal_exp_mean.sort_values().head(7).values) # 7个等级

x_bar=np.arange(7)
# 核心图形绘制
# rect=ax1.bar(left=x_bar,height=data,width=0.5,color='lightblue')
#The *left* kwarg to `bar` is deprecated use *x* instead. Support for *left* will be removed in Matplotlib 3.0

rect=ax2.bar(x=x_bar,height=data2,width=0.5,color='lightblue')

# 向各条形上添加数据标签
for rec in rect:
    x=rec.get_x()
    height=rec.get_height()
    ax2.text(x-0.05,1.03*height,str(height)+'元')

# 绘制x,y坐标轴刻度及标签,标题
ax2.set_xticks(x_bar)
ax2.set_xticklabels(tuple(sal_exp_mean.sort_values().head(7).index))
ax2.set_ylabel('平均工资水平(单位:元)')
ax2.set_title('平均工资水平与工作经验的关系')
ax2.grid(True)
ax2.set_ylim(0,68000)
3.4.3 工资水平与地区分析结果图表展示
3.4.3.1 地区数据清洗
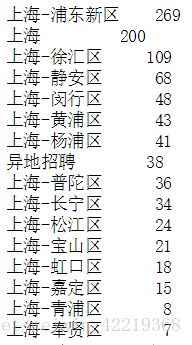
df_new['location']=df_new['location'].str.strip().replace('深圳-福田区','深圳')
df_new['location']=df_new['location'].str.strip().replace('上海-浦东新区','上海')
df_new['location'].value_counts()
df_new['location'].loc[df_new['location']=='广å·�']='广州'
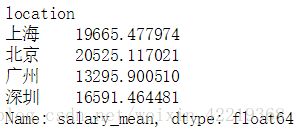
sal_loc_mean=df_new.groupby(['location'])['salary_mean'].mean()
sal_loc_mean.head()
3.4.3.2 地区数据分析结果图表展示
fig=plt.figure(figsize=(8,6))

ax1=plt.subplot(111)
data=np.round(sal_loc_mean.sort_values(ascending=False).values) # 7个等级

x_bar=np.arange(4)
# 核心图形绘制
# rect=ax1.bar(left=x_bar,height=data,width=0.5,color='lightblue')
#The *left* kwarg to `bar` is deprecated use *x* instead. Support for *left* will be removed in Matplotlib 3.0

rect=ax1.bar(x=x_bar,height=data,width=0.5,color='lightblue')

# 向各条形上添加数据标签
for rec in rect:
    x=rec.get_x()
    height=rec.get_height()
    ax1.text(x-0.05,1.03*height,str(height)+'元')

# 绘制x,y坐标轴刻度及标签,标题
ax1.set_xticks(x_bar)
ax1.set_xticklabels(tuple(sal_loc_mean.sort_values(ascending=False).index))
ax1.set_ylabel('平均工资水平(单位:元)')
ax1.set_title('平均工资水平与地区的关系')
ax1.grid(True)
ax1.set_ylim(0,22000)
4 猎聘网站数据清洗及分析
4.1 数据导入
import numpy as np
import pandas as pd
import matplotlib.pyplot as plt
plt.rcParams["font.sans-serif"]=['SimHei']  # 用于正常显示中文标签
plt.rcParams['axes.unicode_minus']=False  # 用来正常显示负号

import warnings
warnings.filterwarnings("ignore")

ai_file=open('./03-lp/猎聘职位信息人工智能_40.csv','r',encoding='utf-8')
df=pd.read_csv(ai_file,
              names=['jobname', 'company', 'company_kind', 'salary', 'welfares', 'require_labels', 'job_describes'],
              header=0)
df.head()
df.info()
4.2 数据查重
df.duplicated().value_counts() # 对返回结果进行计数4.3 查重结果分析
通过对数据的分析发现,猎聘网的招聘信息有其特殊性,收集的1120条信息中,重复信息数竟然达到1092条,竟达到97.5%的重复率。首先检查了代码,排除了数据收集时代码的问题,那么就是网站招聘信息的问题。
结合数据,并查看网站招聘信息的结构发现,其网站中发布信息的公司确实不是很多,且每次公司发布信息都会发布很多条,除了岗位不同而外,其余的信息基本相同,因而在数据分析时被判定为重复内容。因采集到的信息重复率太高,不具有代表性,遂不做分析。
5 通过数据构建机器学习算法模型
5.1 特征工程 - 数据集准备
5.1.1 查看数据
5.1.2 对location数据进行处理
5.1.2.1 查看一下数据
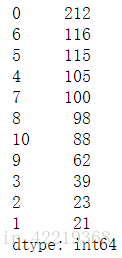
df['location'].value_counts()5.1.2.2 location数据one-hot编码处理
location_onehot = pd.get_dummies(df["location"],drop_first = False, prefix="onehot")
location_onehot.head()
5.1.3 company_attr数据处理
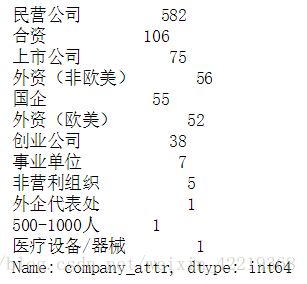
5.1.3.1 查看一下数据
df['company_attr'].value_counts()5.1.3.2 对company_attr数据进行清洗
df['company_attr']=df['company_attr'].str.strip()  #先去除一下空格
df['company_attr'].loc[df['company_attr']=='500-1000人']
# 查看一下数据处理错误的行数
df['company_size'][525]
df['company_field_1'][525]
# 处理一下分错的数据
df['company_size'][525] = '500-1000人'
df['company_field_1'][525] = '房地产'

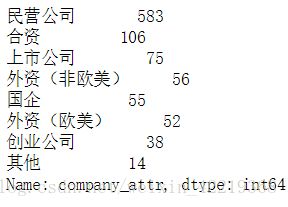
# 前6个500-1000人的公司中3个为民营公司,其中民营公司本身亦为众数,所以分错的数据使用众数代替,另外把出现较少的类型进行组合为‘其他’类型
df['company_attr'].loc[df['company_attr']=='500-1000人']='民营公司'
df['company_attr'].loc[df['company_attr']=='事业单位']='其他'
df['company_attr'].loc[df['company_attr']=='非营利组织']='其他'
df['company_attr'].loc[df['company_attr']=='外企代表处']='其他'
df['company_attr'].loc[df['company_attr']=='医疗设备/器械']='其他'

# 再次查看修改后的数据
df['company_attr'].value_counts()
5.1.3.3 company_attr数据one-hot编码处理
company_attr_onehot = pd.get_dummies(df["company_attr"],drop_first = False, prefix="onehot")5.1.4 company_size数据处理
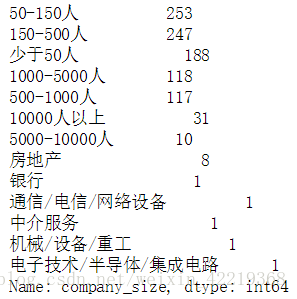
5.1.4.1 查看数据
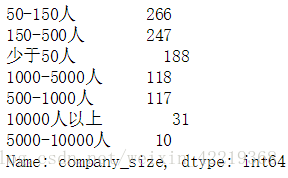
df['company_size'].value_counts()5.1.4.2 将分错数据使用众数代替
df['company_size']=df['company_size'].str.strip()  # 去除一下空格
df['company_size'].loc[df['company_size']=='房地产']='50-150人'
df['company_size'].loc[df['company_size']=='银行']='50-150人'
df['company_size'].loc[df['company_size']=='通信/电信/网络设备']='50-150人'
df['company_size'].loc[df['company_size']=='中介服务']='50-150人'
df['company_size'].loc[df['company_size']=='机械/设备/重工']='50-150人'
df['company_size'].loc[df['company_size']=='电子技术/半导体/集成电路']='50-150人'

df['company_size'].value_counts()
5.1.4.3 company_size数据one-hot编码处理
company_size_onehot = pd.get_dummies(df["company_size"],drop_first = False, prefix="onehot")5.1.5 welfare数据处理
5.1.5.1 合并数据
welfare_count=df[['welfare_1','welfare_2','welfare_3','welfare_4','welfare_5','welfare_6',
                  'welfare_7','welfare_8','welfare_9','welfare_10','welfare_11']]
welfare_count.head()
5.1.5.2 统计公司提供福利个数作为统计参数
welfare_count=welfare_count.fillna('')  # 使用空值代替NaN方便后续统计福利个数
# 定义函数
num_list=[]
def get_welf_num():
    for i in range(len(welfare_count['welfare_1'])):
        count=0
        for j in welfare_count.loc[i]:
            if len(j)!=0:
                count+=1
            else:continue
#         print(count)
        num_list.append(count)
get_welf_num()
welf_count=pd.Series(num_list)

welf_count.value_counts()
5.1.6 edu数据处理
5.1.6.1 查看并合并数据
df['edu']=df['edu'].str.strip()
df['edu'].loc[df['edu']=='中专']='高中及以下'
df['edu'].loc[df['edu']=='高中']='高中及以下'
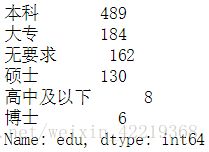
df['edu'].value_counts()
5.1.6.2 edu数据onehot编码
edu_onehot = pd.get_dummies(df["edu"],drop_first = False, prefix="onehot")5.1.7 experience数据onehot编码
experience_onehot = pd.get_dummies(df["experience"],drop_first = False, prefix="onehot")5.1.8 english_requires数据处理
5.1.8.1 english_requires简化处理
df['english_requires'].loc[df['english_requires']=='英语熟练+']='英语'
df['english_requires'].value_counts()
5.1.8.1 english_requires数据onehot编码
english_requires_onehot = pd.get_dummies(df["english_requires"],drop_first = False, prefix="onehot")5.1.9 salary数据处理
5.1.9.1 求均值
salary_min=df['salary_min']
salary_max=df['salary_max']
salary_mean=(salary_min+salary_max)/2
5.1.9.2 均值小于6000的部分全部替换为np.nan值
salary_min.loc[salary_mean <= 6000]=np.nan
salary_max.loc[salary_mean <= 6000]=np.nan
salary_mean.loc[salary_mean <= 6000]=np.nan
salary_max.isnull().value_counts()
5.1.9.3 将salary_mean加入数据中
df['salary_mean']=salary_mean5.1.10 所有数据合并
combine = pd.concat([location_onehot,company_attr_onehot,company_size_onehot,df['welf_count'],edu_onehot,
                     experience_onehot,english_requires_onehot,df['salary_min'],df['salary_max'],df['salary_mean']],axis=1)
combine.head()
5.1.10.1 删除所有出现NaN的行数据 - 主要是salary数据中出现的nan值
combine_new=combine.dropna(axis=0,how='any',inplace=False)
combine_new.reset_index(drop=True)  # 重新编码
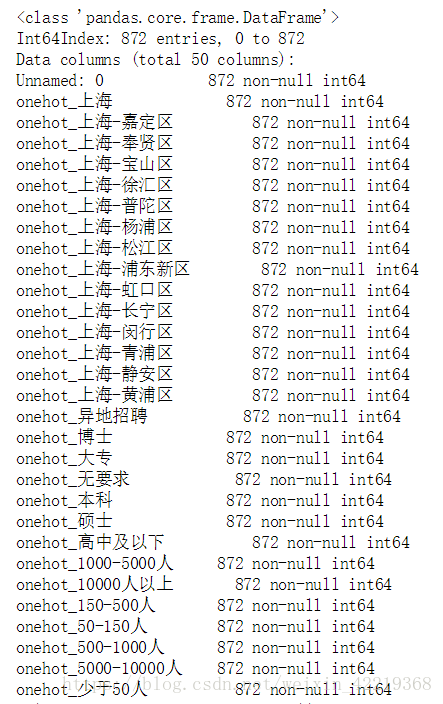
combine_new.info()
5.1.11 将数据集写入文件存储
combine_new.to_csv(path_or_buf='51job训练+测试样本合集(welf_count无编码).csv')5.2 尝试使用聚类算法k-means对数据进行分类
5.2.1 读入数据
5.2.1.1 导入模块
# 导入模块
import numpy as np
import pandas as pd
import matplotlib.pyplot as plt
plt.rcParams["font.sans-serif"]=['SimHei']  # 用于正常显示中文标签
plt.rcParams['axes.unicode_minus']=False  # 用来正常显示负号

from scipy.spatial.distance import cdist  # 用scipy求解距离
from sklearn.cluster import KMeans

# from IPython.core.interactiveshell import InteractiveShell
# InteractiveShell.ast_node_interactivity='all'  # 每个单元格中所有的输出都显示

import warnings
warnings.filterwarnings("ignore")
5.2.1.2 读入数据
train_file=open('51job训练+测试样本合集(welf_count无编码).csv','r',encoding='utf-8')
combine_data=pd.read_csv(train_file)
5.2.2 数据查看与极端值处理
combine_data['salary_mean'].value_counts().sort_index(ascending=False).head(2)# 处理极端值60W,替换为np.nan值,然后删除该行
combine_data['salary_mean'].loc[combine_data['salary_mean']==600000]=np.nan
combine_new=combine_data.dropna(axis=0,how='any',inplace=False)
combine_new=combine_new.drop(['Unnamed: 0'],axis=1)
combine_new.head(2)5.2.3 利用肘部法则来调参 - 挑选最合适的K值
K=range(1,10)
meandistortions=[]
for k in K:
    kmeans=KMeans(n_clusters=k)
    kmeans.fit(combine_new)
    meandistortions.append(sum(np.min(cdist(combine_new,kmeans.cluster_centers_,'euclidean'),axis=1))/combine_new.shape[0])

plt.plot(K,meandistortions,'bx-')
plt.xlabel('k')
plt.ylabel('loss')
plt.title('挑选最佳k值')
根据肘部法则,结合上图可以确定在本数据集中,k值比较适合的值为3。
5.2.4 可视化展示
5.2.4.1 对salary_mean数据进行标记
combine_new['sal_label']=0
# 将平均工资小于等于15000部分定义标签为1
combine_new['sal_label'].loc[combine_new['salary_mean']<= 15000]=1
# 将平均工资大于15000,但小于等于30000部分定义标签为2
combine_new['sal_label'].loc[(15000'salary_mean']) & (combine_new['salary_mean']<= 30000)]=2
# 将平均工资大于30000部分定义标签为3
combine_new['sal_label'].loc[combine_new['salary_mean']> 30000]=3
combine_new['sal_label'].value_counts()
5.2.4.2 数据准备
features=combine_new.drop(['salary_min','salary_max'],axis=1,inplace=False)
features_arr=np.array(features.values)
target=combine_new['sal_label']
target_arr=np.array(target.values)
5.2.4.3 图表展示
for t,marker,col in zip(range(1,4),'>ox','rgb'):
    plt.scatter(features_arr[target_arr == t,0],features_arr[target_arr == t,1],marker=marker,c=col)

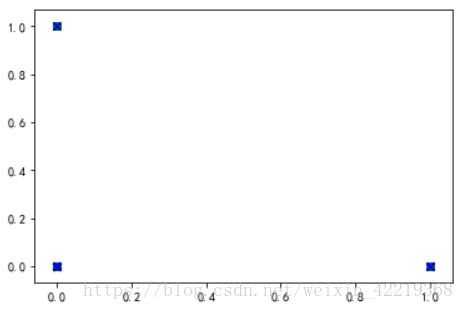
# 可能是数据特征太多,且均为one-hot编码,所以导致数据不够突出
5.2.5 k-means模型
# 创建一个KMeans模型,设置k值为3
kmeans=KMeans(n_clusters=3)
kmeans.fit(combine_new)

# 输出KMeans模型的中心点坐标
kmeans.cluster_centers_

# 输出KMeans模型的所有标签
kmeans.labels_

data=kmeans.fit_predict(combine_new)
data=pd.Series(data)
data.value_counts()     # 预测结果展示
5.3 主流分类算法在数据集上的效果分析
5.3.1 准备数据集
# 新建二分类标签,默认值为0
combine_new['sal_label_2']=0
# 将平均工资大于20000部分定义标签为1
combine_new['sal_label_2'].loc[combine_new['salary_mean']> 20000]=1

# 将数据集拆分为样本点X,标签y
train_X=combine_new.drop(['salary_min','salary_max','sal_label','salary_mean','sal_label_2'],axis=1,inplace=False)
train_y=combine_new['sal_label_2']
5.3.2 拆分训练集和数据集
# 导入model_selection对数据集进行拆分
from sklearn import model_selection

# 将数据集按照70%训练集,30%测试集的成分进行拆分
X_train,X_test,y_train,y_test=model_selection.train_test_split(train_X,train_y,test_size=0.3,random_state=42)
5.3.3 训练模型
# 导入相应模块
from sklearn import metrics

from sklearn.linear_model import LogisticRegression
from sklearn.svm import SVC,LinearSVC
from sklearn.neighbors import KNeighborsClassifier
from sklearn.tree import DecisionTreeClassifier
from sklearn.ensemble import RandomForestClassifier
5.3.3.1 LogisticRegression
lr=LogisticRegression()
lr.fit(X_train,y_train)

print("train accurary:",lr.score(X_train,y_train))
print("test accurary:",lr.score(X_test,y_test))
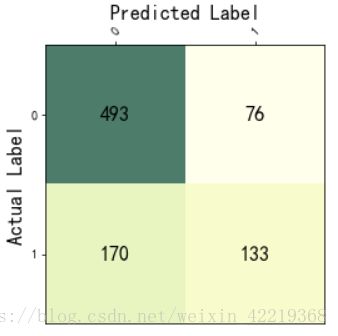
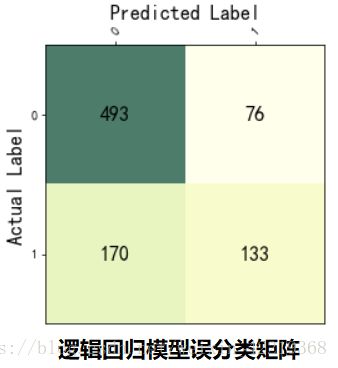
5.3.3.1.1**逻辑回归模型误分类矩阵图表展示**
from sklearn import metrics

train_y_pred=lr.predict(train_X) #对训练集进行预测,输出标签
train_y_pred_prob=lr.predict_proba(train_X) # 对训练集进行预测,输出概率

# 误分类矩阵
cnf_matrix=metrics.confusion_matrix(train_y,train_y_pred)

# 准确率
precision = metrics.accuracy_score(train_y,train_y_pred)

# 通过图表直观一点的展现误分类矩阵
def show_confusion_matrix(cnf_matrix,class_labels):
    plt.matshow(cnf_matrix,cmap=plt.cm.YlGn,alpha=0.7)
    ax=plt.gca()
    ax.set_xlabel("Predicted Label",fontsize=16)
    ax.set_xticks(range(0,len(class_labels)))
    ax.set_xticklabels(class_labels,rotation=45)
    ax.set_ylabel("Actual Label",fontsize=16,rotation=90)
    ax.set_yticks(range(0,len(class_labels)))
    ax.set_yticklabels(class_labels)
    ax.xaxis.set_label_position("top")
    ax.xaxis.tick_top()

    for row in range(len(cnf_matrix)):
        for col in range(len(cnf_matrix[row])):
            ax.text(col,row,cnf_matrix[row][col],va="center",ha="center",fontsize=16)

class_labels=[0,1]
show_confusion_matrix(cnf_matrix,class_labels)
5.3.3.2 SVM
svc=SVC()
svc.fit(X_train,y_train)

print("train accurary:",svc.score(X_train,y_train))
print("test accurary:",svc.score(X_test,y_test))
5.3.3.3 KNN
knn=KNeighborsClassifier(n_neighbors=3)
knn.fit(X_train,y_train)

print("train accurary:",knn.score(X_train,y_train))
print("test accurary:",knn.score(X_test,y_test))![]()
5.3.3.4 Descition Tree
dtree=DecisionTreeClassifier()
dtree.fit(X_train,y_train)

print("train accurary:",dtree.score(X_train,y_train))
print("test accurary:",dtree.score(X_test,y_test))
5.3.3.5 Random Forest
random_forest=RandomForestClassifier(n_estimators=10)
random_forest.fit(X_train,y_train)

print("train accurary:",random_forest.score(X_train,y_train))
print("test accurary:",random_forest.score(X_test,y_test))
5.3.4 各模型结果分析
5.3.4.1 各模型结果对比
5.3.4.2 对比分析结论:
在本例中,通过测试集验证训练集训练的各模型的准确率可以得出以下结论:
- 通过测试集测试的准确率可以看出,逻辑回归模型的准确率最高,在70.23%,SVM其次为69.85%,决策树的效果最差,仅为62.6%;
- 在模型的稳定性方面可以看出,逻辑回归模型最稳定,而决策树和随机森林存在明显的过拟合现象,在训练集的准确率在95%左右,但测试集的准确率只有不到70%;
- KNN算法存在轻微的过拟合现象,在训练集的准确率为79.67%,而测试集只有69.5%;
- SVM算法最不容易过拟合,在训练集的准确率甚至低于测试集,且准确率为第二;
- 虽然随机森林与决策树都存在过拟合的状况,但是随机森林在测试集的准确度有明显提高;
- 在本例中:LogisticRegression > SVM > KNN > Random Forest > Descition Tree
