Python数学建模 多元线性回归
文章目录
- 基于Python的数学建模
- 生成回归数据
- 多元线性回归
-
- 多重共线性检验(方差膨胀因子VIF)
- 多重共线性处理
- 变量间相关性分析
-
- 正态检验
- Pearson相关系数
- 建立多元回归模型
-
- 拟合模型
- 绘制拟合图
- 异方差检验
- 自相关性检验
基于Python的数学建模
- Github仓库:Mathematical-modeling
生成回归数据
import numpy as np
from sklearn.datasets import make_regression
feature,target = make_regression(n_samples=100, n_features=5, n_informative=3, random_state=666)
多元线性回归
- y = β 0 + β 1 x 1 + ⋯ + β p x p + ϵ y=\beta_{0}+\beta_{1}x_{1}+\cdots+\beta_{p}x_{p}+\epsilon y=β0+β1x1+⋯+βpxp+ϵ
- 基本假设
- 回归模型设定是正确的
- 对于每个 x j x_{j} xj, 0 < j ≤ k 0 < j \le k 0<j≤k具有变异性。同时,样本量最少满足 n ≥ k + 1 n \ge k+1 n≥k+1,且 X j X_{j} Xj之间不存在多重共线性
- 随机干扰项条件零均值 E ( μ ∣ X ) = 0 E(\mu | X)=0 E(μ∣X)=0
- 随机干扰项条件同方差与序列不相关
- 随机干扰项正态分布
多重共线性检验(方差膨胀因子VIF)
- V I F i = 1 1 − R i 2 VIF_{i}=\frac{1}{1-R_{i}^{2}} VIFi=1−Ri21
- 其中 R i R_{i} Ri为第 i i i个变量 X i X_{i} Xi与其他全部变量 X j , ( i = 1 , 2 , 3 , ⋯ , k ; i ≠ j ) X_{j},(i=1,2,3,\cdots,k;i \ne j) Xj,(i=1,2,3,⋯,k;i=j)的复相关系数;
复相关系数即可决系数 R 2 R^{2} R2的算术平方根,也即拟合优度的算术平方根。
这个可决系数 R i 2 R_{i}^{2} Ri2是指用 X i X_{i} Xi做因变量,对其他全部 X j , ( i = 1 , 2 , 3 , ⋯ , k ; i ≠ j ) X_{j},(i=1,2,3,\cdots,k;i \ne j) Xj,(i=1,2,3,⋯,k;i=j)做一个新的回归以后得到的可决系数。
- V I F VIF VIF通常以10作为判断边界。
- 当 V I F < 10 VIF < 10 VIF<10,不存在多重共线性;
- 当 10 ≤ V I F < 100 10 \le VIF < 100 10≤VIF<100,存在较强的多重共线性;
- 当 V I F ≥ 100 VIF \ge 100 VIF≥100, 存在严重多重共线性。
- 多重共线性是普遍存在的,轻微的多重共线性问题可不采取措施。
- 严重的多重共线性问题,一般可根据经验或通过分析回归结果发现。如影响系数符号,重要的解释变量t值很低。要根据不同情况采取必要措施。
- 如果模型仅用于预测,则只要拟合程度好,可不处理多重共线性问题,存在多重共线性的模型用于预测时,往往不影响预测结果。
from statsmodels.stats.outliers_influence import variance_inflation_factor
# 输入变量
# exog:所有解释变量
# exog_idx:解释变量的columns标签
for i in range(feature.shape[1]):
    print("第{}个解释变量的VIF值为{}".format(i+1,variance_inflation_factor(feature,i)))
多重共线性处理
- 实际应用中,若存在多重共线性,需要消除多重共线性,不能直接建立多元线性回归模型;
- 待补充
变量间相关性分析
正态检验
- Pearson相关系数以及典型相关分析都要求样本数据满足正态分布的要求
- 因此首先对样本数据的正态分布进行检验
- JB检验(大样本 n>30)
- Shapior-wilk检验(小样本 3
- KS检验(Kolmogorov-Smirnov)
from scipy import stats

print("样本的数据长度:",feature.shape[0])
# Statstic: 代表显著性水平
# P: 代表概率论与数理统计中的P值
for i in range(feature.shape[1]):
    jb_value,p = stats.jarque_bera(feature[:,i])
    if p < 0.05:
        judge = '拒绝原假设'
    else:
        judge = '接受原假设'
    print("第{}个变量的Test Statstic为{}, P值为:{}, {}".format(i,jb_value,p,judge))
Pearson相关系数
import pandas as pd

pd.DataFrame(feature).corr(method='pearson')
建立多元回归模型
拟合模型
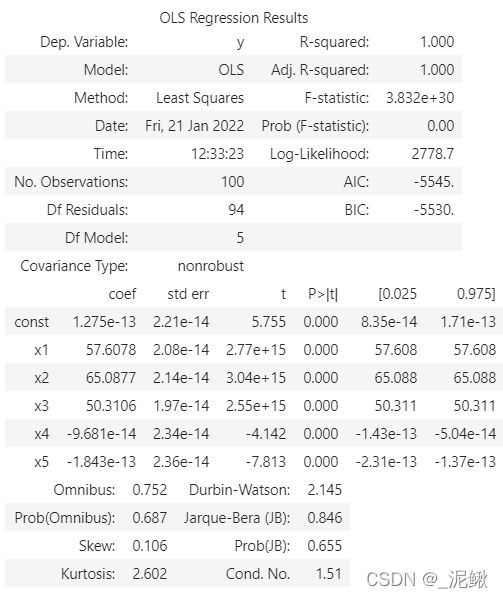
- R-squared,即表示拟合优度 R 2 R^{2} R2,用来衡量估计的模型对观测值的拟合程度。它的值越接近1说明模型越好;
- Adj.R-squared,即调整后的 R 2 R^{2} R2,同时考虑了样本量 n n n和回归中自变量的个数 k k k的影响;
- F-statistic:方差分析
- H 0 : H_{0}: H0:所有回归系数都等于零。 H 1 : H_{1}: H1:所有回归系数不全为零。
- 若Prob (F-statistic)即P值小于0.05,则拒绝原假设,认为多元线性回归模型总体显著。
- 若 F > F α ( K n , − k − 1 ) F > F_{\alpha}(K_{n},-k-1) F>Fα(Kn,−k−1),则接受原假设,认为多元线性回归模型总体不显著。
- 若 F ≤ F α ( K n , − k − 1 ) F \le F_{\alpha}(K_{n},-k-1) F≤Fα(Kn,−k−1),则拒绝原假设,认为多元线性回归模型总体显著。
- 单个变量的显著性检验:t统计量
- 与F统计量类似,若P值小于0.05,则拒绝原假设,认为该自变量显著,对因变量解释性较强。
# 可以通过Scipy计算F统计量和T统计量
from scipy.stats import f,t
F_Theroy = f.ppf(q=0.95, dfn=5, dfd=10-5-1)
print('F: {}'.format(F_Theroy))
T_Theroy = t.ppf(q=0.975, df=100-5-1)
print('T: {}'.format(T_Theroy))
import statsmodels.api as sm

X = feature
Y = target
X = sm.add_constant(X) # 添加截距项
model = sm.OLS(Y,X).fit()
model.summary()
#绘制最佳拟合线:标签用的是训练数据的预测值y_train_pred
y_pred = model.predict(X)
fig,ax = plt.subplots(figsize=(8,4))
ax.plot(Y,color='#00b0ff',label="Observations",linewidth=1.5)
ax.plot(y_pred,color='#ff3d00',label="Prediction",linewidth=1.5)
ax.legend(loc="upper left",fontsize=12)
ax.grid(alpha=0.6)
ax.tick_params(labelsize=14)
绘制拟合图
import matplotlib.pyplot as plt
y_pred = model.predict(X)
fig,ax = plt.subplots(figsize=(8,4))
ax.plot(Y,color='#00b0ff',label="Observations",linewidth=1.5)
ax.plot(y_pred,color='#ff3d00',label="Prediction",linewidth=1.5)
ax.legend(loc="upper left",fontsize=12)
ax.grid(alpha=0.6)
ax.tick_params(labelsize=14)
异方差检验
- 检验多元线性回归方差是否存在异方差
from statsmodels.stats.diagnostic import spec_white

X= feature
X=sm.add_constant(X) # 添加截距项
error = model.resid  #模型的残差
statistic,p,n = spec_white(error,X)
print("The test statistic: {};\n\
    P Value: {};\n\
        The degree of Freedom: {};".format(statistic,p,n))
自相关性检验
from statsmodels.stats.diagnostic import acorr_breusch_godfrey
lm, p_lm, f, p_f = acorr_breusch_godfrey(model)
print("Lagrange multiplier test statistic: {};\n\
    P Value-LM: {};\n\
        F Statistic: {};\n\
            P Value-F{}".format(lm, p_lm, f, p_f))


