Prometheus Operator实战—— Prometheus、Alertmanager、Grafana 监控Springboot服务
1. Spring Boot 工程集成 Micrometer
1.1引入依赖
  org.springframework.boot
  spring-boot-starter-actuator


  io.micrometer
  micrometer-registry-prometheus
1.2配置
方式一:修改配置文件application.yml
management:
  endpoints:
    web:
      exposure:
        include:
          - prometheus
          - health
  metrics:
    tags:
      application: ${spring.application.name}
这里 management.endpoints.web.exposure.include 配置为开启 Actuator 服务,因为Spring Boot Actuator 会自动配置一个 URL 为 /actuator/Prometheus 的 HTTP 服务来供 Prometheus 抓取数据,不过默认该服务是关闭的,该配置将打开对应或者所有的 Actuator 服务。
management.metrics.tags.application 配置会将该工程应用名称添加到计量器注册表的 tag 中去,方便后边 Prometheus 根据应用名称来区分不同的服务。
方式二:添加Spring 配置 向Prometheus 添加application 的tag
management.endpoints.web.exposure.include 还是要有的
public class PrometheusConfiguration {

    @Value("${spring.application.name}")
    private String applicationName;

    @Bean
    MeterRegistryCustomizer appMetricsCommonTags() {
        return registry -> registry.config().commonTags("application", applicationName);
    }
}
1.3 运行查看监控效果
启动项目,访问 http://8080/actuator, 就可以看到Actuator提供的所有监控
{
  "_links": {
    "self": {
      "href": "http://localhost:8080/actuator",
      "templated": false
    },
    "health": {
      "href": "http://localhost:8080/actuator/health",
      "templated": false
    },
    "health-path": {
      "href": "http://localhost:8080/actuator/health/{*path}",
      "templated": true
    },
    "prometheus": {
      "href": "http://localhost:8080/actuator/prometheus",
      "templated": false
    }
  }
}
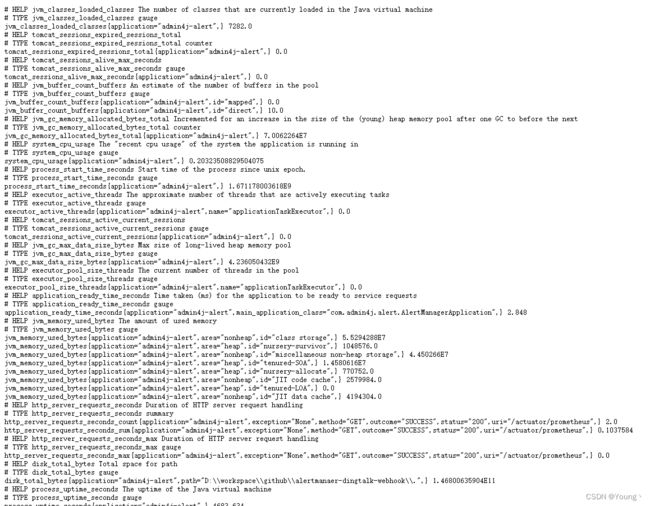
参考监控数据 http://localhost:8080/actuator/prometheus
1.4创建自定义监控
我们可以利用Prometheus client自定义metric
这一步非必要,只是创建业务需要的监控数据
@Service
public class PrometheusMeter {

    @Autowired
    private CollectorRegistry collectorRegistry;

    // 定义name为prometheus_counter的counter
    public Counter prometheusCounter(){
        return Counter.build().name("prometheus_counter").help("prometheus counter test")
                .register(collectorRegistry);
    }

    @PostConstruct
    public void init(){
        Counter counter = prometheusCounter();
        new Thread(()-> {
            while (true){
                counter.inc();
                try {
                    Thread.sleep(5000);
                } catch (InterruptedException e) {
                    e.printStackTrace();
                }
            }
        }).start();
    }
}
1.5 运行在k8s环境下
示例工程:https://github.com/admin4j/alertmanager-dingtalk-webhook
docker: docker pull admin4j/alertmanager-dingtalk-webhook
k8s 运行yml文件
apiVersion: apps/v1
kind: Deployment
metadata:
  name: alertmanager-dingtalk-webhook
spec:
  replicas: 1
  selector:
    matchLabels:
      app: alertmanager-dingtalk-webhook
  template:
    metadata:
      labels:
        app: alertmanager-dingtalk-webhook
    spec:
      affinity:
        podAntiAffinity:
          preferredDuringSchedulingIgnoredDuringExecution:
            - weight: 100
              podAffinityTerm:
                topologyKey: kubernetes.io/hostname
                labelSelector:
                  matchExpressions:
                    - key: app
                      operator: In
                      values:
                        - alertmanager-dingtalk-webhook
      containers:
        - name: alertmanager-dingtalk-webhook
          image: admin4j/alertmanager-dingtalk-webhook:latest
          imagePullPolicy: Always
          resources:
            limits:
              memory: 1G
            requests:
              memory: 1G
          livenessProbe:
            httpGet:
              path: /actuator/health
              port: 8080
              scheme: HTTP
            initialDelaySeconds: 60
            timeoutSeconds: 10
            periodSeconds: 120
          readinessProbe:
            httpGet:
              path: /actuator/health
              port: 8080
              scheme: HTTP
            initialDelaySeconds: 10
            timeoutSeconds: 10
            periodSeconds: 120
          env:
            - name: dingTalk_assessToken
              valueFrom:
                configMapKeyRef:
                  name: alertmanager-webhook-cm
                  key: dingTalk_assessToken
            - name: dingTalk_secret
              valueFrom:
                configMapKeyRef:
                  name: alertmanager-webhook-cm
                  key: dingTalk_secret
---
kind: ConfigMap
apiVersion: v1
metadata:
  name: alertmanager-webhook-cm
data:
  dingTalk_assessToken: d54bd0d41decb444d8e716fa661c03233d10f75559a0041c60148a1de8bb802x
  dingTalk_secret: SEC7f5baedc3bc637942041077a6e5aeb4275cf403ad3c057e75b0ed8921dc2662x

----
kind: Service
apiVersion: v1
metadata:
  name: alertmanager-webhook-service
spec:
  ports:
    - protocol: TCP
      port: 8080
      targetPort: 8080
  selector:
    app: alertmanager-dingtalk-webhook
  type: ClusterIP
  sessionAffinity: None
2.集成 Prometheus、Alertmanager、Grafana
安装方式参考 Prometheus Operator 极简配置方式在k8s一条龙安装Prometheus 监控这里就不细说了。
3. Prometheus自动发现 springboot 应用
方式一:使用Prometheus Operator 的自定义资源 CRD
3.1 使用 PodMonitors
apiVersion: monitoring.coreos.com/v1
kind: PodMonitor
metadata:
  name: alertmanager-webhook
  labels:
    app: alertmanager-webhook
spec:
  selector:
    matchLabels:
      app: alertmanager-webhook
  namespaceSelector: {}
  podMetricsEndpoints:
  - port: web
    interval: 15s
    path: /metrics
类似地,修改 Prometheus CRD对像的用spec.podMonitorSelector字段。
apiVersion: monitoring.coreos.com/v1
kind: Prometheus
metadata:
  name: prometheus
spec:
  serviceAccountName: prometheus
  podMonitorSelector:
    matchLabels:
      team: alertmanager-webhook
3.2 使用 ServiceMonitors
与 PodMonitors 具体参考 Prometheus Operator 极简配置方式在k8s一条龙安装Prometheus 监控

3.3 使用注解
参考 我的 【k8s 实战】Prometheus Operator 高级配置- 监控Kubernetes自动发现 一文
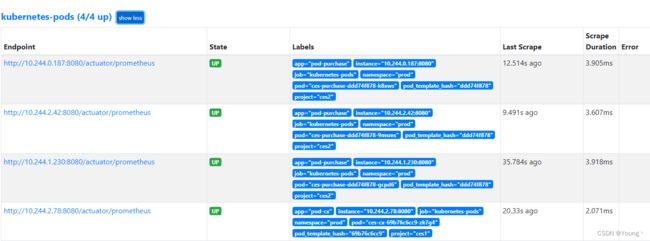
使用注解让 Prometheus 自动发现pod
修改yml,添加注解 prometheus.io/xx注解
apiVersion: apps/v1
kind: Deployment
metadata:
  name: alertmanager-dingtalk-webhook
spec:
  replicas: 1
  selector:
    matchLabels:
      app: alertmanager-dingtalk-webhook
  template:
    metadata:
      labels:
        app: alertmanager-dingtalk-webhook
    annotations:
      prometheus.io/path: /actuator/prometheus
      prometheus.io/prot: '8080'
      prometheus.io/scrape: 'true'
4.使用 Grafana Dashboard 展示监控项数据
去Grafana 官网找一个 springboot 监控模板 https://grafana.com/grafana/dashboards/

搜索 spring boot 或者 JVM选择一个监控模板
我们这里选择 12900和4701

12900 效果

4701效果

5. 利用AlertManager 发送报警消息
添加PrometheusRule CRD
apiVersion: monitoring.coreos.com/v1
kind: PrometheusRule
metadata:
  creationTimestamp: null
  labels:
    prometheus: k8s
    role: alert-rules
  name: prometheus-springboot-rules
spec:
  groups:
  - name: springboot
    rules:
    - alert: JvmMemoryFillingUp
      expr: (sum by (instance)(jvm_memory_used_bytes{area="heap"}) / sum by (instance)(jvm_memory_max_bytes{area="heap"})) * 100 > 80
      for: 2m
      labels:
        severity: warning
      annotations:
        summary: JVM memory filling up (instance {{ $labels.instance }})
        description: "JVM memory is filling up (> 80%)\n  VALUE = {{ $value }}\n  LABELS = {{ $labels }}"
添加成功

参考
Prometheus Operator 极简配置方式在k8s一条龙安装Prometheus 监控