pytorch 二分类 生物数据预测
写在前面
这几天做了一些简单的对比实验,使用数据为长度39(处理后)的字母串形式的多肽链样本。本文将使用的函数打包记录。
模型架构
反卷积 nn.ConvTranspose2d和BCEloss nn.BCELoss()
将字母串编码成整数后用embedding层嵌入到向量空间中。
嵌入后需要用unsqueeze手动添加一层维度即一维通道,同卷积核的输入维度匹配。
由于嵌入后的样本特征维度为39*39较小,调用cv模型前先经过一层反卷积,能够放大特征维度。
torch.nn.ConvTranspose2d(in_channels, out_channels, kernel_size, stride=1, padding=0, output_padding=0, groups=1, bias=True, dilation=1, padding_mode='zeros', device=None, dtype=None)
训练时用到的也是二分类最典型的Loss Function:Binary Cross Entropy:
B C E L o s s = − y t r u e log ( p ( x ) ) + ( 1 − y t r u e ) log ( 1 − p ( x ) ) , y t r u e ∈ { 0 , 1 } BCELoss = -y_{true} \log(p(x)) + (1-y_{true})\log(1-p(x)),y_{true} \in \{0,1\} BCELoss=−ytruelog(p(x))+(1−ytrue)log(1−p(x)),ytrue∈{0,1}
p ( x ) p(x) p(x)为对样本 x x x的预测概率。
nn.BCELoss()的输入为一维向量,数值为 ( 0 , 1 ) (0,1) (0,1)内的概率,所以需要经过sigmoid函数,并用torch.squeeze将size为1的维度消去。
class network(nn.Module):
    def __init__(self, net, em_dim=39, win_size=39):
        super().__init__()
        self.win_size = win_size
        self.em_dim = em_dim
        self.kernal = int((self.win_size-1)/2)
        self.embedding = nn.Embedding(22, em_dim)
        self.conv = nn.ConvTranspose2d(1, 3, 19, 2)#反卷积
        self.net = net
        self.classifier = nn.Linear(2, 1)

    def forward(self, x):
        x = self.embedding(x)
        x = torch.unsqueeze(x, dim=1)
        #(batchsize,seq_length,em_dim) -> (batchsize,input_tunnel,seq_length,em_dim)
        x = self.conv(x)
        x = self.net(x)
        x = self.classifier(x)
        x = torch.sigmoid(x)
        x = torch.squeeze(x, dim=-1)
        #注意这里的squeeze:(batchsize,1)->batchsize
        return x
resnet18
模型架构调用timm即可
import timm
resnet = timm.create_model('resnet18', pretrained=False, num_classes=2)
model = network(resnet)
定义一个简单的train函数:
def train(model, num_epoch, train_loader, criterion, optimizer, device):
    total_step = len(train_loader)
    for epoch in range(num_epoch):
        for i, (images, labels) in enumerate(train_loader):
            images = images.to(device)
            labels = labels.to(device)

        # Forward pass
            outputs = model(images)
            loss = criterion(outputs, labels.float())

        # Backward and optimize
            optimizer.zero_grad()
            loss.backward()
            optimizer.step()

            if (i+1) % 100 == 0:
                print('Epoch [{}/{}], Step [{}/{}], Loss: {:.4f}'
                      .format(epoch+1, num_epoch, i+1, total_step, loss.item()))
AlexNet
class AlexNet(nn.Module):
    def __init__(self, num_classes: int = 2, dropout: float = 0.5) -> None:
        super().__init__()
        self.features = nn.Sequential(
            nn.Conv2d(3, 64, kernel_size=11, stride=4, padding=2),
            nn.ReLU(inplace=True),
            nn.MaxPool2d(kernel_size=3, stride=2),
            nn.Conv2d(64, 192, kernel_size=5, padding=2),
            nn.ReLU(inplace=True),
            nn.MaxPool2d(kernel_size=3, stride=2),
            nn.Conv2d(192, 384, kernel_size=3, padding=1),
            nn.ReLU(inplace=True),
            nn.Conv2d(384, 256, kernel_size=3, padding=1),
            nn.ReLU(inplace=True),
            nn.Conv2d(256, 256, kernel_size=3, padding=1),
            nn.ReLU(inplace=True),
            nn.MaxPool2d(kernel_size=3, stride=2),
        )
        self.avgpool = nn.AdaptiveAvgPool2d((6, 6))
        self.classifier = nn.Sequential(
            nn.Dropout(p=dropout),
            nn.Linear(256 * 6 * 6, 4096),
            nn.ReLU(inplace=True),
            nn.Dropout(p=dropout),
            nn.Linear(4096, 4096),
            nn.ReLU(inplace=True),
            nn.Linear(4096, num_classes),
        )

    def forward(self, x: torch.Tensor) -> torch.Tensor:
        x = self.features(x)
        x = self.avgpool(x)
        x = torch.flatten(x, 1)
        x = self.classifier(x)
        return x
model = network(AlexNet())
LSTM
LSTM模型是自己搭的
class Lstm(nn.Module):
    def __init__(self, em_dim=39, num_layers=1, num_classes=2):
        super(Lstm, self).__init__()
        self.num_layers = num_layers
        self.embedding = nn.Embedding(22, em_dim)
        self.lstm1 = nn.LSTM(em_dim, 64,
                             self.num_layers, batch_first=True, bidirectional=False)
        self.fc_task = nn.Sequential(
            nn.Linear(64, 32),
            nn.Dropout(0.5),
            nn.ReLU(),
            nn.Linear(32, 2),
        )
        self.classifier = nn.Linear(2, 1)
        self.dropout = nn.Dropout(0.5)

    def forward(self, x):
        x = self.embedding(x)
        batch_size, features, seq_len = x.size()
        out, (h_n, _) = self.lstm1(x)
        h_n = h_n.view(batch_size, out.size()[-1])

        out = self.fc_task(h_n)
        out = self.classifier(out)
        x = torch.sigmoid(out)
        x = torch.squeeze(x)
        return x
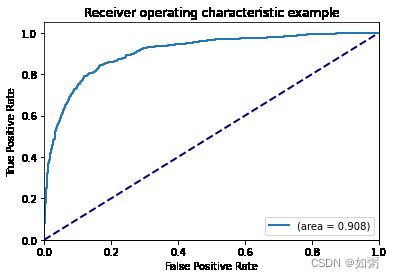
模型评估:ROC和PR曲线
测试的时候,绘制一条ROC曲线和PR曲线
def compute_metrics(prob, ytest):
## INPUT:prob:全部测试集的预测概率;ytest:测试集真实标签
## OUTPUT: False Positive Rate,True Positive Rate,auc

    fpr, tpr, _ = roc_curve(ytest, prob)
    auc_ = sklearn.metrics.auc(fpr, tpr)
    return fpr, tpr, auc_

def draw_once_roc(prob, ytest):
    plt.figure()
    plt.plot([0, 1], [0, 1], color='navy', lw=2, linestyle='--')
    fpr, tpr, auc = compute_metrics(prob, ytest)
    lw = 2
    plt.plot(fpr, tpr,
             lw=lw, label='(area = %0.3f)' % auc)

    plt.xlim([0.0, 1.0])
    plt.ylim([0.0, 1.05])
    plt.xlabel('False Positive Rate')
    plt.ylabel('True Positive Rate')
    plt.title('ROC curve')
    plt.legend(loc="lower right")
    plt.show()

def draw_once_pr(prob,ytest):
    # models: a dictionary model_name:prob
    plt.figure()
    precision, recall, _ = precision_recall_curve(ytest, prob)
    auc_precision_recall = sklearn.metrics.auc(recall, precision)
    lw = 2
    plt.plot(recall, precision,
                 lw=lw, label=model_name+'(area = %0.3f)' % auc_precision_recall)

    plt.xlim([0.0, 1.0])
    plt.ylim([0.0, 1.05])
    plt.xlabel('Recall')
    plt.ylabel('Precision')
    plt.title('Precision/Recall Curve')
    plt.legend(loc="lower right")
    plt.show()
def draw_ROC(models):
    # models: a dictionary (model_name:prob)
    plt.figure()
    plt.plot([0, 1], [0, 1], color='navy', lw=2, linestyle='--')
    for i, model_name in enumerate(models):
        prob = models[model_name]
        fpr, tpr, auc = compute_metrics(prob)
        lw = 2
        plt.plot(fpr, tpr,
                 lw=lw, label=model_name+'(area = %0.3f)' % auc)

    plt.xlim([0.0, 1.0])
    plt.ylim([0.0, 1.05])
    plt.xlabel('False Positive Rate')
    plt.ylabel('True Positive Rate')
    plt.title('ROC curve')
    plt.legend(loc="lower right")
    plt.show()


def draw_PR(models):
    # models: a dictionary model_name:prob
    plt.figure()
    for i, model_name in enumerate(models):
        prob = models[model_name]
        precision, recall, _ = precision_recall_curve(ytest, prob)
        auc_precision_recall = sklearn.metrics.auc(recall, precision)
        lw = 2
        plt.plot(recall, precision,
                 lw=lw, label=model_name+'(area = %0.3f)' % auc_precision_recall)

    plt.xlim([0.0, 1.0])
    plt.ylim([0.0, 1.05])
    plt.xlabel('Recall')
    plt.ylabel('Precision')
    plt.title('Precision/Recall Curve')
    plt.legend(loc="lower right")
    plt.show()
