基于python的三维射线追踪库-ttcrpy详解(1)
基于python的三维射线追踪库-ttcrpy详解(1)
文章目录
- 基于python的三维射线追踪库-ttcrpy详解(1)
-
- 1、ttcrpy介绍
- 2、ttcrpy安装
- 3、ttcrpy网格介绍
- 4、代码解析及模型示例
- 5、参考文献
- 6、完整代码
- 搬砖不易,走过路过,点个赞可好。
1、ttcrpy介绍
ttcrpy是一个用于计算初至时间和射线追踪路径的python软件包,开发时考虑了在地球物理方面的应用,例如基于射线的地震/GPR层析成像和微震事件定位(联合震源速度反演)。
该软件包可以用来执行计算2D和3D和矩形网格,以及2D三角形网格和3D四面体网格,用python来实现。该软件包实现了三种不同的射线追踪算法:快速扫描法、最短路径法和动态网格最短路径法。
该计算可以在多核机器上并行运行。核心计算代码是用C++写的,已经用cython包装好了。在python中可以快捷使用。
2、ttcrpy安装
电脑快捷键wins+R,打开快捷界面输入cmd,在cmd中利用pip可直接安装ttcrpy库,输入命令如下:
pip install ttcrpy
注意:安装和使用ttcrpy需要安装相关支持的库,如numpy、scipy、vtk,其中vtk的安装易出错。
3、ttcrpy网格介绍
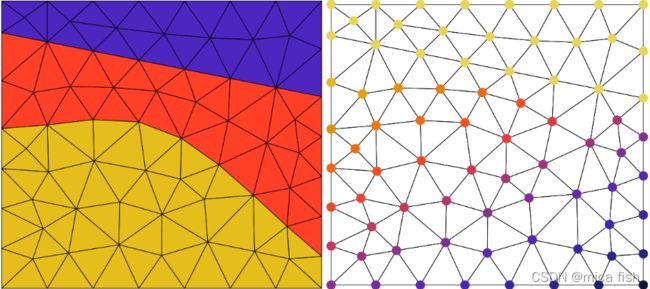
ttcrpy中可以构建规则网格和不规则三角网格或四面体网格,在进行走时成像或射线追踪时需要对模型进行网格剖分,ttcrpy中给出了很灵活的网格剖分方式。

如上图所示,在最左边的情况下,慢度值被分配给网格的单元。在最右边的情况下,慢度值被分配给网格节点。在后一种情况下,两个节点之间的走时计算是通过取两个节点处慢度值的平均值来完成的。
选择主要取决于应用。例如,在走时层析成像中,问题是使用走时数据来估计慢度模型。直线网格包含的单元比节点少,因此,如果将慢度值分配给单元,未知参数的数量会更少。对于四面体网格,节点的数量少于单元的数量,并且如果将慢度值分配给节点,要求解的系统将更小。
4、代码解析及模型示例
在pthon中运行代码,第一步需要导入各种需要的库,导入ttcrpy库。
import ttcrpy.rgrid as rg
import numpy as np
import matplotlib.pyplot as plt
from mpl_toolkits.mplot3d import Axes3D
根据所需的模型,建立相应的三维网格。
# 创建网格
x = np.arange(15.0)
y = np.arange(14.0)
z = np.arange(21.0)
在这里,我们建立x、y、z三个方向网格数分别为15、14、21。然后建立一个三维速度模型,
# 三维速度模型
# 速度沿z方向线性变化
a = 1.0
V20 = 3.0
b = (V20-a)/20.0

V = np.empty((x.size, y.size, z.size))
for n in range(z.size):
    V[:, :, n] = a + b*z[n]
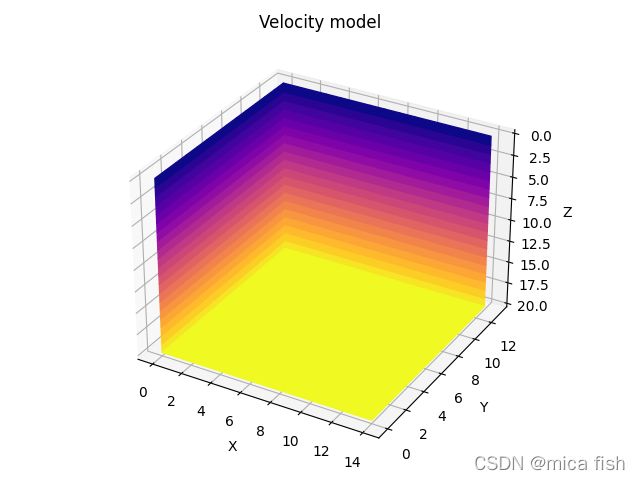
我们假设模型的速度值为沿着z方向增大,在python中显示一下模型,
# 画图,显示一下模型
fig = plt.figure(1)
ax = fig.add_subplot(111, projection='3d')

min_val = V.min()
max_val = V.max()
n_x, n_y, n_z = V.shape
colormap = plt.cm.plasma

cut = V[0,:,:]
Y, Z = np.mgrid[0:n_y, 0:n_z]
X = np.zeros((n_y, n_z))
ax.plot_surface(X, Y, Z, rstride=1, cstride=1, facecolors=colormap((cut-min_val)/(max_val-min_val)), shade=False)
cut = V[:,-1,:]
X, Z = np.mgrid[0:n_x, 0:n_z]
Y = y[-1] + np.zeros((n_x, n_z))
ax.plot_surface(X, Y, Z, rstride=1, cstride=1, facecolors=colormap((cut-min_val)/(max_val-min_val)), shade=False)
cut = V[:,:,-1]
X, Y = np.mgrid[0:n_x, 0:n_y]
Z = z[-1] + np.zeros((n_x, n_y))
ax.plot_surface(X, Y, Z, rstride=1, cstride=1, facecolors=colormap((cut-min_val)/(max_val-min_val)), shade=False)
ax.invert_zaxis()
ax.set_title("Velocity model")
ax.set_xlabel('X')
ax.set_ylabel('Y')
ax.set_zlabel('Z')
fig.tight_layout()
# plt.show()
模型结果如下图所示。

在速度模型建立正确的情况下,下一步就是设置发射点坐标与接收点坐标,
# 发射点和接收点的坐标

src = np.array([[0.5, 0.5, 0.5]])
rcv = np.array([[2.0, 2.0, 0.5],
                [4.0, 4.0, 0.5],
                [6.0, 6.0, 0.5],
                [8.0, 8.0, 0.5],
                [10.0, 10.0, 0.5],
                [12.0, 12.0, 2.5],
                [12.0, 12.0, 4.5],
                [12.0, 12.0, 6.5],
                [12.0, 12.0, 8.5],
                [12.0, 12.0, 10.5],
                [12.0, 12.0, 12.5],
                [12.0, 12.0, 14.5],
                [12.0, 12.0, 16.5],
                [10.0, 5.0, 20.0]])
将速度模型转换为慢度模型,、
# 慢度模型
grid = rg.Grid3d(x, y, z, cell_slowness=False)

# we need to input slowness
slowness = 1./V
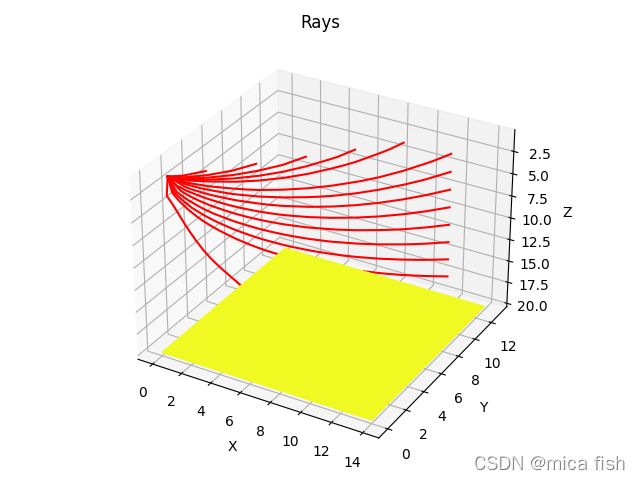
运行ttcrpy代码,计算射线路径与初至走时。
tt, rays = grid.raytrace(src, rcv, slowness, return_rays=True)
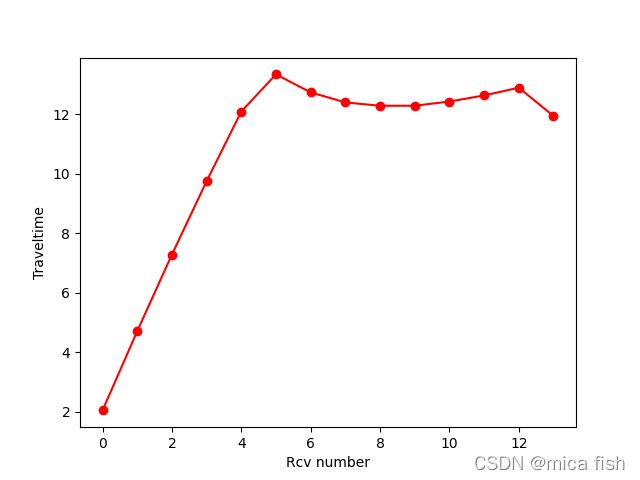
显示走时
plt.figure(2)
plt.plot(tt, 'r-o')
plt.xlabel('Rcv number')
plt.ylabel('Traveltime')
# plt.show()
fig = plt.figure(3)
ax = fig.add_subplot(111, projection='3d')
min_val = V.min()
max_val = V.max()
n_x, n_y, n_z = V.shape
colormap = plt.cm.plasma

cut = V[:,:,-1]
X, Y = np.mgrid[0:n_x, 0:n_y]
Z = z[-1] + np.zeros((n_x, n_y))
ax.plot_surface(X, Y, Z, rstride=1, cstride=1, facecolors=colormap((cut-min_val)/(max_val-min_val)), shade=False)

for r in rays:
    ax.plot(r[:,0], r[:,1], r[:,2],'r-')

ax.invert_zaxis()
ax.set_title("Rays")
ax.set_xlabel('X')
ax.set_ylabel('Y')
ax.set_zlabel('Z')
fig.tight_layout()

plt.show()
5、参考文献
Nasr, Maher; Giroux, Bernard et Dupuis, Christian J. (2020). A hybrid approach to compute seismic travel times in 3D tetrahedral meshes. Geophys. Prospect. DOI : 10.1111/1365-2478.12930 https://onlinelibrary.wiley.com/doi/abs/10.1111/1365-2478.12930
Giroux B et Larouche B. 2013. Task-parallel implementation of 3D shortest path raytracing for geophysical applications, Computers & Geosciences, 54, 130-141. DOI : https://www.sciencedirect.com/science/article/pii/S0098300412004128
Nasr M, Giroux B, Dupuis JC, 2018. An optimized approach to compute traveltimes in 3D unstructured meshes. SEG Technical Program Expanded Abstracts 2018, pp. 5073-5077. DOI : 10.1190/segam2018-2997918.1 https://library.seg.org/doi/10.1190/segam2018-2997918.1
Giroux B. 2014. Comparison of grid-based methods for raytracing on unstructured meshes, SEG Technical Program Expanded Abstracts 2014, pp. 3388-3392. DOI : https://library.seg.org/doi/10.1190/segam2014-1197.1
Giroux B, 2013. Shortest path raytracing in tetrahedral meshes. 75th EAGE Conference & Exhibition, Londres, 10-13 June. DOI : 10.3997/2214-4609.20130236 https://www.earthdoc.org/content/papers/10.3997/2214-4609.20130236
6、完整代码
import ttcrpy.rgrid as rg
import numpy as np
import matplotlib.pyplot as plt
from mpl_toolkits.mplot3d import Axes3D

# 创建网格
x = np.arange(15.0)
y = np.arange(14.0)
z = np.arange(21.0)

# 三维速度模型
# 速度沿z方向线性变化
a = 1.0
V20 = 3.0
b = (V20-a)/20.0

V = np.empty((x.size, y.size, z.size))
for n in range(z.size):
    V[:, :, n] = a + b*z[n]

# 画图,显示一下模型
fig = plt.figure(1)
ax = fig.add_subplot(111, projection='3d')

min_val = V.min()
max_val = V.max()
n_x, n_y, n_z = V.shape
colormap = plt.cm.plasma

cut = V[0,:,:]
Y, Z = np.mgrid[0:n_y, 0:n_z]
X = np.zeros((n_y, n_z))
ax.plot_surface(X, Y, Z, rstride=1, cstride=1, facecolors=colormap((cut-min_val)/(max_val-min_val)), shade=False)
cut = V[:,-1,:]
X, Z = np.mgrid[0:n_x, 0:n_z]
Y = y[-1] + np.zeros((n_x, n_z))
ax.plot_surface(X, Y, Z, rstride=1, cstride=1, facecolors=colormap((cut-min_val)/(max_val-min_val)), shade=False)
cut = V[:,:,-1]
X, Y = np.mgrid[0:n_x, 0:n_y]
Z = z[-1] + np.zeros((n_x, n_y))
ax.plot_surface(X, Y, Z, rstride=1, cstride=1, facecolors=colormap((cut-min_val)/(max_val-min_val)), shade=False)
ax.invert_zaxis()
ax.set_title("Velocity model")
ax.set_xlabel('X')
ax.set_ylabel('Y')
ax.set_zlabel('Z')
fig.tight_layout()
# plt.show()


# src and rcv should be 2D arrays
# 发射点和接收点的坐标

src = np.array([[0.5, 0.5, 0.5]])
rcv = np.array([[2.0, 2.0, 0.5],
                [4.0, 4.0, 0.5],
                [6.0, 6.0, 0.5],
                [8.0, 8.0, 0.5],
                [10.0, 10.0, 0.5],
                [12.0, 12.0, 2.5],
                [12.0, 12.0, 4.5],
                [12.0, 12.0, 6.5],
                [12.0, 12.0, 8.5],
                [12.0, 12.0, 10.5],
                [12.0, 12.0, 12.5],
                [12.0, 12.0, 14.5],
                [12.0, 12.0, 16.5],
                [10.0, 5.0, 20.0]])

# slowness will de assigned to grid nodes, we must pass cell_slowness=False
# 慢度模型
grid = rg.Grid3d(x, y, z, cell_slowness=False)

# we need to input slowness
slowness = 1./V

tt, rays = grid.raytrace(src, rcv, slowness, return_rays=True)

plt.figure(2)
plt.plot(tt, 'r-o')
plt.xlabel('Rcv number')
plt.ylabel('Traveltime')
# plt.show()

fig = plt.figure(3)
ax = fig.add_subplot(111, projection='3d')
min_val = V.min()
max_val = V.max()
n_x, n_y, n_z = V.shape
colormap = plt.cm.plasma

cut = V[:,:,-1]
X, Y = np.mgrid[0:n_x, 0:n_y]
Z = z[-1] + np.zeros((n_x, n_y))
ax.plot_surface(X, Y, Z, rstride=1, cstride=1, facecolors=colormap((cut-min_val)/(max_val-min_val)), shade=False)

for r in rays:
    ax.plot(r[:,0], r[:,1], r[:,2],'r-')

ax.invert_zaxis()
ax.set_title("Rays")
ax.set_xlabel('X')
ax.set_ylabel('Y')
ax.set_zlabel('Z')
fig.tight_layout()

plt.show()

