%% examp3.1-1
h = line([0 1],[0 1])
get(h)

%% examp3.1-2
subplot(1, 2, 1);
h1 = line([0 1],[0 1]) ;
text(0, 0.5, '未改变线宽') ;
subplot(1, 2, 2);
h2 = line([0 1],[0 1]) ;
set(h2, 'LineWidth', 3)
text(0, 0.5, '已改变线宽') ;

%% examp3.2-1
x = 0 : 0.25 : 2*pi;
y = sin(x);
plot(x, y, '-ro',...
              'LineWidth',2,...
              'MarkerEdgeColor','k',...
              'MarkerFaceColor',[0.49,  1,  0.63],...
              'MarkerSize',12)
xlabel('X');
ylabel('Y');

%% examp3.2-2
t = linspace(0,2*pi,60);
x = cos(t);
y = sin(t);
plot(t,x,':','LineWidth',2);
hold on;
plot(t,y,'r-.','LineWidth',3);
plot(x,y,'k','LineWidth',2.5);
axis equal;
xlabel('X');
ylabel('Y');
legend('x = cos(t)','y = sin(t)','单位圆','Location','NorthEast');

%% examp3.2-3
x = linspace(-2, 2, 200);
y = -x.*cos(5*exp(1-x.^2));
plot(x,y, 'k', 'linewidth', 2);
h = annotation('textarrow', [0.5875, 0.6536], [0.2929, 0.4095]);
set(h, 'string','f(x) = -xcos(5e^{1-x^2})', 'fontsize', 15);
h = title('这是一个很美的曲线', 'fontsize', 18, 'fontweight', 'bold');
set(h, 'position', [-0.00345622 1.35769 1.00011]);
axis([-2, 2, -2, 2]);
xlabel('X');
ylabel('Y');

%% examp3.2-4
x = linspace(0,2*pi,60);
y = sin(x);
h = plot(x,y);
grid on;
set(h,'Color','k','LineWidth',2);
XTickLabel = {'0','\pi/2','\pi','3\pi/2','2\pi'};
set(gca,'XTick',0:pi/2:2*pi,...
           'XTickLabel',XTickLabel,...
           'TickDir','out');
xlabel('0 \leq \Theta \leq 2\pi');
ylabel('sin(\Theta)');
text(8*pi/9,sin(8*pi/9),'\leftarrow sin(8\pi \div 9)',...
        'HorizontalAlignment','left')
axis([0 2*pi -1 1]);

%% examp3.2-5
subplot(3, 3, 1);            % 绘制3行3列子图中的第1个
fx = @(x)200*sin(x)./x;      % 定义匿名函数
fplot(fx, [-20 20]);         % 绘制函数图像,设置横坐标范围为[-20,  20]
title('y = 200*sin(x)/x');   % 设置标题

subplot(3, 3, 2);            % 绘制3行3列子图中的第2个
fxy = @(x,y)x.^2 + y.^2 - 1; % 定义匿名函数
ezplot(fxy, [-1.1 1.1]);     % 绘制单位圆,横坐标从-1.1到1.1
axis equal;                  % 设置坐标系的显示方式
title('单位圆');

subplot(3, 3, 3);            % 绘制3行3列子图中的第3个
ft = @(t)1+cos(t);           % 定义匿名函数
ezpolar(ft);                 % 绘制心形图
title('心形图');

subplot(3, 3, 4);
x = [10  10  20  25  35];
name = {'赵', '钱', '孙', '李', '谢'};
explode = [0 0 0 0 1];
pie(x, explode, name)
title('饼图');

subplot(3, 3, 5);
stairs(-2*pi:0.5:2*pi,sin(-2*pi:0.5:2*pi));
title('楼梯图');

subplot(3, 3, 6);
stem(-2*pi:0.5:2*pi,sin(-2*pi:0.5:2*pi));
title('火柴杆图');

subplot(3, 3, 7);
Z = eig(randn(20,20));
compass(Z);
title('罗盘图');

subplot(3, 3, 8);
theta = (-90:10:90)*pi/180;
r = 2*ones(size(theta));
[u,v] = pol2cart(theta,r);
feather(u,v);
title('羽毛图');

subplot(3, 3, 9);
t = (1/16:1/8:1)'*2*pi;
fill(sin(t), cos(t),'r');
axis square;   title('八边形');

%% examp3.3-1
t = linspace(0, 10*pi, 300);
plot3(20*sin(t), 20*cos(t), t, 'r', 'linewidth', 2);
hold on
quiver3(0,0,0,1,0,0,25,'k','filled','LineWidth',2);
quiver3(0,0,0,0,1,0,25,'k','filled','LineWidth',2);
quiver3(0,0,0,0,0,1,40,'k','filled','LineWidth',2);
grid on
xlabel('X'); ylabel('Y'); zlabel('Z');
axis([-25 25 -25 25 0 40]);
view(-210,30);

%% examp3.3-2
[x,y] = meshgrid(1:4, 2:5)
plot(x, y, 'r',x', y', 'r', x, y, 'k.','markersize',18);
axis([0 5 1 6]);
xlabel('X');  ylabel('Y');

%% examp3.3-3
t = linspace(-pi,pi,20);
[X, Y] = meshgrid(t);
Z = cos(X).*sin(Y);

subplot(2, 2, 1);
mesh(X, Y, Z);
title('mesh');

subplot(2, 2, 2);
surf(X, Y, Z);
alpha(0.5);
title('surf');

subplot(2, 2, 3);
surfl(X, Y, Z);
title('surfl');

subplot(2, 2, 4);
surfc(X, Y, Z);
title('surfc');

%% examp3.3-4
[X,Y] = meshgrid(-2:0.2:2);
Z = X.*exp(-X.^2 - Y.^2);
[DX,DY] = gradient(Z,0.2,0.2);
contour(X,Y,Z) ;
hold on ;
quiver(X,Y,DX,DY) ;
h = get(gca,'Children');
set(h, 'Color','k');

%% examp3.3-5
% 绘制圆柱面
subplot(2,2,1);
[x,y,z] = cylinder;
surf(x,y,z);
title('圆柱面')

% 绘制哑铃面
subplot(2,2,2);
t = 0:pi/10:2*pi;
[X,Y,Z] = cylinder(2+cos(t));
surf(X,Y,Z);
title('哑铃面')

% 绘制球面,半径为10,球心 (1,1,1)
subplot(2,2,3);
[x,y,z] = sphere;
surf(10*x+1,10*y+1,10*z+1);
axis equal;
title('球面')

% 绘制椭球面
subplot(2,2,4);
a=4;
b=3;
t = -b:b/10:b;
[x,y,z] = cylinder(a*sqrt(1-t.^2/b^2),30);
surf(x,y,z);
title('椭球面')

%% examp3.3-6
% 调用ezsurf函数绘制参数方程形式的螺旋面,并设置参数取值范围
x = @(u,v)u.*sin(v);
y = @(u,v)u.*cos(v);
z = @(u,v)4*v;
ezsurf(x,y,z,[-2*pi,2*pi,-2*pi,2*pi])
axis([-7 7 -7 7 -30 30]);    % 设置坐标轴显示范围

%% examp3.3-7
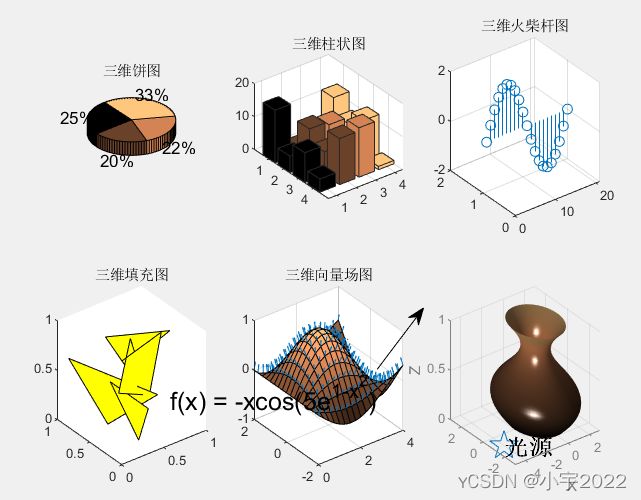
% 饼图
subplot(2,3,1);
pie3([2347,1827,2043,3025]);
title('三维饼图');

% 柱状图
subplot(2,3,2);
bar3(magic(4));
title('三维柱状图');

% 火柴杆图
subplot(2,3,3);
y=2*sin(0:pi/10:2*pi);
stem3(y);
title('三维火柴杆图');

% 填充图
subplot(2,3,4);
fill3(rand(3,5),rand(3,5),rand(3,5), 'y' );
title('三维填充图');

% 三维向量场图
subplot(2,3,5);
[X,Y] = meshgrid(0:0.25:4,-2:0.25:2);
Z = sin(X).*cos(Y);
[Nx,Ny,Nz] = surfnorm(X,Y,Z);
surf(X,Y,Z);
hold on;
quiver3(X,Y,Z,Nx,Ny,Nz,0.5);
title('三维向量场图');
axis([0 4 -2 2 -1 1]);

% 立体切片图(四维图)
subplot(2,3,6);
t = linspace(-2,2,20);
[X,Y,Z] = meshgrid(t,t,t);
V = X.*exp(-X.^2-Y.^2-Z.^2);
xslice = [-1.2,0.8,2];
yslice = 2;
zslice = [-2,0];
slice(X,Y,Z,V,xslice,yslice,zslice);
title('立体切片图(四维图)');

%% examp3.3-8
t = 0:pi/20:2*pi;
[x,y,z] = cylinder(2+sin(t),100);
surf(x,y,z);
xlabel('X'); ylabel('Y'); zlabel('Z');
set(gca,'color','none');
set(gca,'XColor',[0.5 0.5 0.5]);
set(gca,'YColor',[0.5 0.5 0.5]);
set(gca,'ZColor',[0.5 0.5 0.5]);
shading interp;
colormap(copper);
light('Posi',[-4 -1 0]);
lighting phong;
material metal;
hold on;
plot3(-4,-1,0,'p','markersize', 18);
text(-4,-1,0,'光源','fontsize',14,'fontweight','bold');```
