SpringBoot+Prometheus+Grafana 监控预警
文章目录
- 部署 Grafana
- 部署 Prometheus
- 配置 SpringBoot
- Prometheus 收集指标
- Grafana 展示
-
- 配置数据源
- 配置监控大盘
- Grafana 预警
-
- 配置预警规则
- 配置触发点
- 配置通知策略
- 常用指标
部署 Grafana
在 K8S 部署 Grafana
官方文档:https://github.com/bitnami/charts/tree/master/bitnami/grafana
加入仓库
helm repo add bitnami https://charts.bitnami.com/bitnami
开始部署
helm install grafana bitnami/grafana -f values.yaml -n component
自定义 values.yaml
global:
  storageClass: "nfs-client"
admin:
  password: "123456"
ingress:
  enabled: true
  ingressClassName: "nginx"
  hostname: "grafana.saas.api.gd-xxx.com"
smtp:
  enabled: true
  user: [email protected]
  password: "xxxx"
  host: smtp.exmail.qq.com:465
  fromAddress: [email protected]
  fromName: "grafana-notify"
搭建本地存储可以参考 k8s 安装本地 storageClass
搭建NFS存储可以参考 K8S 集群使用 NFS 做 storageclass
部署 Prometheus
鉴于 Prometheus 用 k8s 部署起来有点繁琐,镜像是外国源也拉不下来,所以选择 docker 来部署
官方文档:https://prometheus.io/docs/prometheus/latest/installation/
配置 prometheus.yml,默认配置 https://prometheus.io/docs/prometheus/latest/getting_started/
mkdir /opt/promethus
cd /opt/promethus/
vim prometheus.yml
global:
  scrape_interval:     15s # By default, scrape targets every 15 seconds.

  # Attach these labels to any time series or alerts when communicating with
  # external systems (federation, remote storage, Alertmanager).
  external_labels:
    monitor: 'codelab-monitor'

# A scrape configuration containing exactly one endpoint to scrape:
# Here it's Prometheus itself.
scrape_configs:
  # The job name is added as a label `job=` to any timeseries scraped from this config.
  - job_name: 'prometheus'

    # Override the global default and scrape targets from this job every 5 seconds.
    scrape_interval: 5s

    static_configs:
      - targets: ['localhost:9090']
部署命令
docker pull prom/prometheus

docker run -d \
    -p 9090:9090 \
    -v /opt/prometheus/prometheus.yml:/etc/prometheus/prometheus.yml \
   --name promethenus \
    prom/prometheus
ip 加端口 9090 即可访问
配置 SpringBoot
pom 添加依赖
actuator 输出 springboot 监控的数据,micrometer-registry-prometheus 把 actuator 数据自动映射成 prometheus 的格式
<!-- actuator prometheus 资源监控 -->

<dependency>
    <groupId>org.springframework.boot</groupId>
    <artifactId>spring-boot-starter-actuator</artifactId>
</dependency>
<dependency>
    <groupId>io.micrometer</groupId>
    <artifactId>micrometer-registry-prometheus</artifactId>
</dependency>
application.yml 添加配置
开发监听端口为 8081
management:
  metrics:
    tags:
      application : ${spring.application.name}
  server:
    port: 8081
  endpoints:
    jmx:
      exposure:
        include: "*"
    web:
      exposure:
        include: "*"
  endpoint:
    health:
      show-details: always
重启 springboot 项目,访问 http://ip:8081/actuator/prometheus,即可看到输出指标
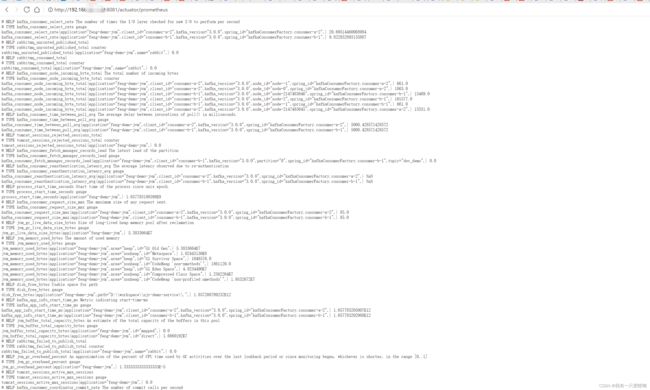
Prometheus 收集指标
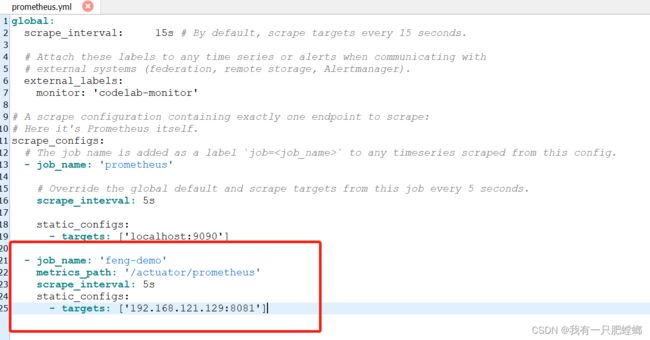
编辑 prometheus.yml,添加 job,targets 和 metrics_path 对应 springboot 得监控链接
  - job_name: 'feng-demo'
    metrics_path: '/actuator/prometheus'
    scrape_interval: 5s
    static_configs:
      - targets: ['192.168.121.129:8081']
重启 prometheus 容器
docker restart promethenus
prometheus 中可看到配置好的 job

Grafana 展示
配置数据源
选择 data sources

新增

选择 prometheus

url 填写 prometheus 的链接

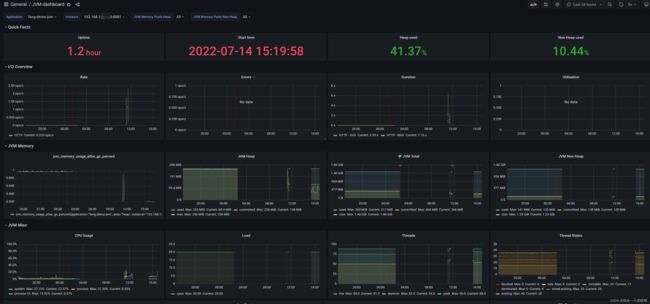
配置监控大盘
import

推荐使用 4701,本人自行配置的大盘附在最后

选择数据源

使用 4701 大盘,需要在 SpringBoot 项目中添加配置
官方文档:https://grafana.com/grafana/dashboards/4701
可以配置在启动类上
 @Bean
 MeterRegistryCustomizer<MeterRegistry> configurer() {
     return (registry) -> registry.config().commonTags("application", "feng-demo-jvm");
 }
完成展示
Grafana 预警
配置预警规则
选择想要预警的指标,点击编辑

创建预警

1、起名、分配文件夹、分组

2、 配置指标
A:定义查询指标
B:定义 A 指标的触发条件
例如:A 指标的最大值超过 3

3、定义 B 指标的时间隔
No Data:没有监控数据,例如断网,或者服务崩溃
Alerting:超时或执行错误

4、配置labels,给监控添加标签

配置触发点
选择 Contact points,点击新建

这里示范选择 webhook,预警时触发接口
Disable resolved message:默认不勾选,效果是预警取消后,也会回调接口

配置通知策略
新建策略

根据标签 lable 筛选预警规则,选择通知触发点

常用指标
一般 java 项目最可能出现的异常就是内存溢出,所以监控内存十分重要
jvm_memory_usage_after_gc_percent{}
jvm 内存占用过的百分比

本人配置的 JSON Model
{
"annotations": {
"list": [
{
"builtIn": 1,
"datasource": {
"type": "datasource",
"uid": "grafana"
},
"enable": true,
"hide": true,
"iconColor": "rgba(0, 211, 255, 1)",
"limit": 100,
"name": "Annotations & Alerts",
"showIn": 0,
"target": {
"limit": 100,
"matchAny": false,
"tags": [],
"type": "dashboard"
},
"type": "dashboard"
},
{
"datasource": {
"type": "prometheus",
"uid": "uGg36Jg4z"
},
"enable": true,
"expr": "resets(process_uptime_seconds{application=\"$application\", instance=\"$instance\"}[1m]) > 0",
"iconColor": "rgba(255, 96, 96, 1)",
"name": "Restart Detection",
"showIn": 0,
"step": "1m",
"tagKeys": "restart-tag",
"textFormat": "uptime reset",
"titleFormat": "Restart"
}
]
},
"description": "Dashboard for Micrometer instrumented applications (Java, Spring Boot, Micronaut)",
"editable": true,
"fiscalYearStartMonth": 0,
"gnetId": 4701,
"graphTooltip": 0,
"id": 1,
"iteration": 1658395023196,
"links": [],
"liveNow": false,
"panels": [
{
"collapsed": false,
"gridPos": {
"h": 1,
"w": 24,
"x": 0,
"y": 0
},
"id": 149,
"panels": [],
"repeat": "application",
"title": "总信息",
"type": "row"
},
{
"aliasColors": {},
"bars": false,
"dashLength": 10,
"dashes": false,
"datasource": {
"type": "prometheus",
"uid": "uGg36Jg4z"
},
"fill": 1,
"fillGradient": 0,
"gridPos": {
"h": 8,
"w": 11,
"x": 0,
"y": 1
},
"hiddenSeries": false,
"id": 141,
"legend": {
"avg": false,
"current": false,
"max": false,
"min": false,
"show": true,
"total": false,
"values": false
},
"lines": true,
"linewidth": 1,
"nullPointMode": "null",
"options": {
"alertThreshold": true
},
"percentage": false,
"pluginVersion": "8.5.6",
"pointradius": 2,
"points": false,
"renderer": "flot",
"seriesOverrides": [],
"spaceLength": 10,
"stack": false,
"steppedLine": false,
"targets": [
{
"datasource": {
"type": "prometheus",
"uid": "uGg36Jg4z"
},
"editorMode": "code",
"expr": "jvm_memory_usage_after_gc_percent{} * 100",
"legendFormat": "{{job}}",
"range": true,
"refId": "A"
}
],
"thresholds": [],
"timeRegions": [],
"title": "jvm 占比",
"tooltip": {
"shared": true,
"sort": 0,
"value_type": "individual"
},
"type": "graph",
"xaxis": {
"mode": "time",
"show": true,
"values": []
},
"yaxes": [
{
"$$hashKey": "object:840",
"format": "percent",
"logBase": 1,
"show": true
},
{
"$$hashKey": "object:841",
"format": "short",
"logBase": 1,
"show": true
}
],
"yaxis": {
"align": false
}
},
{
"datasource": {
"type": "prometheus",
"uid": "uGg36Jg4z"
},
"fieldConfig": {
"defaults": {
"color": {
"mode": "palette-classic"
},
"custom": {
"axisLabel": "",
"axisPlacement": "auto",
"barAlignment": 0,
"drawStyle": "line",
"fillOpacity": 9,
"gradientMode": "none",
"hideFrom": {
"legend": false,
"tooltip": false,
"viz": false
},
"lineInterpolation": "linear",
"lineStyle": {
"fill": "solid"
},
"lineWidth": 1,
"pointSize": 2,
"scaleDistribution": {
"type": "linear"
},
"showPoints": "auto",
"spanNulls": false,
"stacking": {
"group": "A",
"mode": "none"
},
"thresholdsStyle": {
"mode": "off"
}
},
"mappings": [],
"thresholds": {
"mode": "absolute",
"steps": [
{
"color": "green",
"value": null
},
{
"color": "red",
"value": 80
}
]
},
"unit": "percent"
},
"overrides": []
},
"gridPos": {
"h": 8,
"w": 13,
"x": 11,
"y": 1
},
"id": 163,
"options": {
"legend": {
"calcs": [],
"displayMode": "list",
"placement": "bottom"
},
"tooltip": {
"mode": "single",
"sort": "none"
}
},
"targets": [
{
"datasource": {
"type": "prometheus",
"uid": "uGg36Jg4z"
},
"editorMode": "code",
"expr": "system_cpu_usage{} * 100",
"legendFormat": "{{job}}",
"range": true,
"refId": "A"
}
],
"title": "cpu 占比",
"type": "timeseries"
},
{
"collapsed": false,
"datasource": {
"type": "prometheus",
"uid": "uGg36Jg4z"
},
"gridPos": {
"h": 1,
"w": 24,
"x": 0,
"y": 9
},
"id": 125,
"panels": [],
"title": "Quick Facts",
"type": "row"
},
{
"datasource": {
"type": "prometheus",
"uid": "uGg36Jg4z"
},
"fieldConfig": {
"defaults": {
"color": {
"mode": "thresholds"
},
"decimals": 1,
"mappings": [
{
"options": {
"match": "null",
"result": {
"text": "N/A"
}
},
"type": "special"
}
],
"thresholds": {
"mode": "absolute",
"steps": [
{
"color": "green",
"value": null
},
{
"color": "red",
"value": 80
}
]
},
"unit": "s"
},
"overrides": []
},
"gridPos": {
"h": 3,
"w": 5,
"x": 0,
"y": 10
},
"id": 63,
"links": [],
"maxDataPoints": 100,
"options": {
"colorMode": "value",
"graphMode": "none",
"justifyMode": "auto",
"orientation": "horizontal",
"reduceOptions": {
"calcs": [
"lastNotNull"
],
"fields": "",
"values": false
},
"textMode": "auto"
},
"pluginVersion": "8.5.6",
"targets": [
{
"expr": "process_uptime_seconds{application=\"$application\", instance=\"$instance\"}",
"format": "time_series",
"intervalFactor": 2,
"legendFormat": "",
"metric": "",
"refId": "A",
"step": 14400
}
],
"title": "Uptime",
"type": "stat"
},
{
"datasource": {
"type": "prometheus",
"uid": "uGg36Jg4z"
},
"fieldConfig": {
"defaults": {
"color": {
"mode": "thresholds"
},
"mappings": [
{
"options": {
"match": "null",
"result": {
"text": "N/A"
}
},
"type": "special"
}
],
"thresholds": {
"mode": "absolute",
"steps": [
{
"color": "green",
"value": null
},
{
"color": "red",
"value": 80
}
]
},
"unit": "dateTimeAsIso"
},
"overrides": []
},
"gridPos": {
"h": 3,
"w": 6,
"x": 5,
"y": 10
},
"id": 92,
"links": [],
"maxDataPoints": 100,
"options": {
"colorMode": "value",
"graphMode": "none",
"justifyMode": "auto",
"orientation": "horizontal",
"reduceOptions": {
"calcs": [
"lastNotNull"
],
"fields": "",
"values": false
},
"textMode": "auto"
},
"pluginVersion": "8.5.6",
"targets": [
{
"expr": "process_start_time_seconds{application=\"$application\", instance=\"$instance\"}*1000",
"format": "time_series",
"intervalFactor": 2,
"legendFormat": "",
"metric": "",
"refId": "A",
"step": 14400
}
],
"title": "Start time",
"type": "stat"
},
{
"datasource": {
"type": "prometheus",
"uid": "uGg36Jg4z"
},
"fieldConfig": {
"defaults": {
"color": {
"mode": "thresholds"
},
"decimals": 2,
"mappings": [
{
"options": {
"match": "null",
"result": {
"text": "N/A"
}
},
"type": "special"
}
],
"thresholds": {
"mode": "absolute",
"steps": [
{
"color": "rgba(50, 172, 45, 0.97)",
"value": null
},
{
"color": "rgba(237, 129, 40, 0.89)",
"value": 70
},
{
"color": "rgba(245, 54, 54, 0.9)",
"value": 90
}
]
},
"unit": "percent"
},
"overrides": []
},
"gridPos": {
"h": 3,
"w": 4,
"x": 11,
"y": 10
},
"id": 65,
"links": [],
"maxDataPoints": 100,
"options": {
"colorMode": "value",
"graphMode": "none",
"justifyMode": "auto",
"orientation": "horizontal",
"reduceOptions": {
"calcs": [
"lastNotNull"
],
"fields": "",
"values": false
},
"textMode": "auto"
},
"pluginVersion": "8.5.6",
"targets": [
{
"datasource": {
"type": "prometheus",
"uid": "uGg36Jg4z"
},
"expr": "sum(jvm_memory_used_bytes{application=\"$application\", instance=\"$instance\", area=\"heap\"})*100/sum(jvm_memory_max_bytes{application=\"$application\",instance=\"$instance\", area=\"heap\"})",
"format": "time_series",
"intervalFactor": 2,
"legendFormat": "",
"refId": "A",
"step": 14400
}
],
"title": "Heap used",
"type": "stat"
},
{
"datasource": {
"type": "prometheus",
"uid": "uGg36Jg4z"
},
"fieldConfig": {
"defaults": {
"color": {
"mode": "thresholds"
},
"decimals": 2,
"mappings": [
{
"options": {
"match": "null",
"result": {
"text": "N/A"
}
},
"type": "special"
},
{
"options": {
"from": -1e+32,
"result": {
"text": "N/A"
},
"to": 0
},
"type": "range"
}
],
"thresholds": {
"mode": "absolute",
"steps": [
{
"color": "rgba(50, 172, 45, 0.97)",
"value": null
},
{
"color": "rgba(237, 129, 40, 0.89)",
"value": 70
},
{
"color": "rgba(245, 54, 54, 0.9)",
"value": 90
}
]
},
"unit": "percent"
},
"overrides": []
},
"gridPos": {
"h": 3,
"w": 4,
"x": 15,
"y": 10
},
"id": 75,
"links": [],
"maxDataPoints": 100,
"options": {
"colorMode": "value",
"graphMode": "none",
"justifyMode": "auto",
"orientation": "horizontal",
"reduceOptions": {
"calcs": [
"lastNotNull"
],
"fields": "",
"values": false
},
"textMode": "auto"
},
"pluginVersion": "8.5.6",
"targets": [
{
"datasource": {
"type": "prometheus",
"uid": "uGg36Jg4z"
},
"expr": "sum(jvm_memory_used_bytes{application=\"$application\", instance=\"$instance\", area=\"nonheap\"})*100/sum(jvm_memory_max_bytes{application=\"$application\",instance=\"$instance\", area=\"nonheap\"})",
"format": "time_series",
"intervalFactor": 2,
"legendFormat": "",
"refId": "A",
"step": 14400
}
],
"title": "Non-Heap used",
"type": "stat"
},
{
"datasource": {
"type": "prometheus",
"uid": "uGg36Jg4z"
},
"fieldConfig": {
"defaults": {
"color": {
"mode": "thresholds"
},
"mappings": [],
"thresholds": {
"mode": "absolute",
"steps": [
{
"color": "semi-dark-green",
"value": null
},
{
"color": "red",
"value": 80
}
]
},
"unit": "percent"
},
"overrides": []
},
"gridPos": {
"h": 3,
"w": 5,
"x": 19,
"y": 10
},
"id": 171,
"options": {
"colorMode": "value",
"graphMode": "none",
"justifyMode": "auto",
"orientation": "auto",
"reduceOptions": {
"calcs": [
"lastNotNull"
],
"fields": "",
"values": false
},
"textMode": "auto"
},
"pluginVersion": "8.5.6",
"targets": [
{
"datasource": {
"type": "prometheus",
"uid": "uGg36Jg4z"
},
"expr": "sum(jvm_memory_used_bytes{application=\"$application\", instance=\"$instance\"})*100/sum(jvm_memory_max_bytes{application=\"$application\",instance=\"$instance\"})",
"refId": "A"
}
],
"title": "jvm 总占比",
"type": "stat"
},
{
"collapsed": false,
"datasource": {
"type": "prometheus",
"uid": "uGg36Jg4z"
},
"gridPos": {
"h": 1,
"w": 24,
"x": 0,
"y": 13
},
"id": 126,
"panels": [],
"title": "I/O Overview",
"type": "row"
},
{
"aliasColors": {},
"bars": false,
"dashLength": 10,
"dashes": false,
"datasource": {
"type": "prometheus",
"uid": "uGg36Jg4z"
},
"fill": 1,
"fillGradient": 0,
"gridPos": {
"h": 7,
"w": 11,
"x": 0,
"y": 14
},
"hiddenSeries": false,
"id": 111,
"legend": {
"avg": false,
"current": true,
"max": false,
"min": false,
"show": true,
"total": false,
"values": true
},
"lines": true,
"linewidth": 1,
"links": [],
"nullPointMode": "null",
"options": {
"alertThreshold": true
},
"percentage": false,
"pluginVersion": "8.5.6",
"pointradius": 5,
"points": false,
"renderer": "flot",
"seriesOverrides": [],
"spaceLength": 10,
"stack": false,
"steppedLine": false,
"targets": [
{
"expr": "sum(rate(http_server_requests_seconds_count{application=\"$application\", instance=\"$instance\"}[1m]))",
"format": "time_series",
"intervalFactor": 1,
"legendFormat": "HTTP",
"refId": "A"
}
],
"thresholds": [],
"timeRegions": [],
"title": "Rate",
"tooltip": {
"shared": true,
"sort": 0,
"value_type": "individual"
},
"type": "graph",
"xaxis": {
"mode": "time",
"show": true,
"values": []
},
"yaxes": [
{
"format": "ops",
"logBase": 1,
"min": "0",
"show": true
},
{
"format": "short",
"logBase": 1,
"show": true
}
],
"yaxis": {
"align": false
}
},
{
"aliasColors": {
"HTTP": "#890f02",
"HTTP - 5xx": "#bf1b00"
},
"bars": false,
"dashLength": 10,
"dashes": false,
"datasource": {
"type": "prometheus",
"uid": "uGg36Jg4z"
},
"fill": 1,
"fillGradient": 0,
"gridPos": {
"h": 7,
"w": 7,
"x": 11,
"y": 14
},
"hiddenSeries": false,
"id": 112,
"legend": {
"avg": false,
"current": true,
"max": false,
"min": false,
"show": true,
"total": false,
"values": true
},
"lines": true,
"linewidth": 1,
"links": [],
"nullPointMode": "null",
"options": {
"alertThreshold": true
},
"percentage": false,
"pluginVersion": "8.5.6",
"pointradius": 5,
"points": false,
"renderer": "flot",
"seriesOverrides": [],
"spaceLength": 10,
"stack": false,
"steppedLine": false,
"targets": [
{
"expr": "sum(rate(http_server_requests_seconds_count{application=\"$application\", instance=\"$instance\", status=~\"5..\"}[1m]))",
"format": "time_series",
"intervalFactor": 1,
"legendFormat": "HTTP - 5xx",
"refId": "A"
}
],
"thresholds": [],
"timeRegions": [],
"title": "Errors",
"tooltip": {
"shared": true,
"sort": 0,
"value_type": "individual"
},
"type": "graph",
"xaxis": {
"mode": "time",
"show": true,
"values": []
},
"yaxes": [
{
"format": "ops",
"logBase": 1,
"min": "0",
"show": true
},
{
"format": "short",
"logBase": 1,
"show": true
}
],
"yaxis": {
"align": false
}
},
{
"aliasColors": {},
"bars": false,
"dashLength": 10,
"dashes": false,
"datasource": {
"type": "prometheus",
"uid": "uGg36Jg4z"
},
"fill": 1,
"fillGradient": 0,
"gridPos": {
"h": 7,
"w": 6,
"x": 18,
"y": 14
},
"hiddenSeries": false,
"id": 113,
"legend": {
"avg": false,
"current": true,
"max": false,
"min": false,
"show": true,
"total": false,
"values": true
},
"lines": true,
"linewidth": 1,
"links": [],
"nullPointMode": "null",
"options": {
"alertThreshold": true
},
"percentage": false,
"pluginVersion": "8.5.6",
"pointradius": 5,
"points": false,
"renderer": "flot",
"seriesOverrides": [],
"spaceLength": 10,
"stack": false,
"steppedLine": false,
"targets": [
{
"expr": "sum(rate(http_server_requests_seconds_sum{application=\"$application\", instance=\"$instance\", status!~\"5..\"}[1m]))/sum(rate(http_server_requests_seconds_count{application=\"$application\", instance=\"$instance\", status!~\"5..\"}[1m]))",
"format": "time_series",
"hide": false,
"intervalFactor": 1,
"legendFormat": "HTTP - AVG",
"refId": "A"
},
{
"expr": "max(http_server_requests_seconds_max{application=\"$application\", instance=\"$instance\", status!~\"5..\"})",
"format": "time_series",
"hide": false,
"intervalFactor": 1,
"legendFormat": "HTTP - MAX",
"refId": "B"
}
],
"thresholds": [],
"timeRegions": [],
"title": "Duration",
"tooltip": {
"shared": true,
"sort": 0,
"value_type": "individual"
},
"type": "graph",
"xaxis": {
"mode": "time",
"show": true,
"values": []
},
"yaxes": [
{
"format": "s",
"logBase": 1,
"min": "0",
"show": true
},
{
"format": "short",
"logBase": 1,
"show": true
}
],
"yaxis": {
"align": false
}
},
{
"collapsed": false,
"datasource": {
"type": "prometheus",
"uid": "uGg36Jg4z"
},
"gridPos": {
"h": 1,
"w": 24,
"x": 0,
"y": 21
},
"id": 127,
"panels": [],
"title": "JVM Memory",
"type": "row"
},
{
"aliasColors": {},
"bars": false,
"dashLength": 10,
"dashes": false,
"datasource": {
"type": "prometheus",
"uid": "uGg36Jg4z"
},
"editable": true,
"error": false,
"fieldConfig": {
"defaults": {
"unit": "bytes"
},
"overrides": []
},
"fill": 1,
"fillGradient": 0,
"grid": {
"leftLogBase": 1,
"rightLogBase": 1
},
"gridPos": {
"h": 7,
"w": 11,
"x": 0,
"y": 22
},
"hiddenSeries": false,
"id": 24,
"legend": {
"avg": false,
"current": true,
"max": true,
"min": false,
"show": true,
"total": false,
"values": true
},
"lines": true,
"linewidth": 1,
"links": [],
"nullPointMode": "null",
"options": {
"alertThreshold": true
},
"percentage": false,
"pluginVersion": "8.5.6",
"pointradius": 1,
"points": true,
"renderer": "flot",
"seriesOverrides": [],
"spaceLength": 10,
"stack": false,
"steppedLine": false,
"targets": [
{
"expr": "sum(jvm_memory_used_bytes{application=\"$application\", instance=\"$instance\", area=\"heap\"})",
"format": "time_series",
"intervalFactor": 2,
"legendFormat": "used",
"metric": "",
"refId": "A",
"step": 2400
},
{
"expr": "sum(jvm_memory_committed_bytes{application=\"$application\", instance=\"$instance\", area=\"heap\"})",
"format": "time_series",
"intervalFactor": 2,
"legendFormat": "committed",
"refId": "B",
"step": 2400
},
{
"expr": "sum(jvm_memory_max_bytes{application=\"$application\", instance=\"$instance\", area=\"heap\"})",
"format": "time_series",
"intervalFactor": 2,
"legendFormat": "max",
"refId": "C",
"step": 2400
}
],
"thresholds": [],
"timeRegions": [],
"title": "JVM Heap",
"tooltip": {
"msResolution": false,
"shared": true,
"sort": 1,
"value_type": "cumulative"
},
"type": "graph",
"x-axis": true,
"xaxis": {
"mode": "time",
"show": true,
"values": []
},
"y-axis": true,
"y_formats": [
"mbytes",
"short"
],
"yaxes": [
{
"format": "bytes",
"logBase": 1,
"min": 0,
"show": true
},
{
"format": "short",
"logBase": 1,
"show": true
}
],
"yaxis": {
"align": false
}
},
{
"aliasColors": {},
"bars": false,
"dashLength": 10,
"dashes": false,
"datasource": {
"type": "prometheus",
"uid": "uGg36Jg4z"
},
"editable": true,
"error": false,
"fill": 1,
"fillGradient": 0,
"grid": {
"leftLogBase": 1,
"rightLogBase": 1
},
"gridPos": {
"h": 7,
"w": 7,
"x": 11,
"y": 22
},
"hiddenSeries": false,
"id": 26,
"legend": {
"alignAsTable": false,
"avg": false,
"current": true,
"max": true,
"min": false,
"show": true,
"total": false,
"values": true
},
"lines": true,
"linewidth": 1,
"links": [],
"nullPointMode": "null",
"options": {
"alertThreshold": true
},
"percentage": false,
"pluginVersion": "8.5.6",
"pointradius": 1,
"points": true,
"renderer": "flot",
"seriesOverrides": [],
"spaceLength": 10,
"stack": false,
"steppedLine": false,
"targets": [
{
"datasource": {
"type": "prometheus",
"uid": "uGg36Jg4z"
},
"expr": "sum(jvm_memory_used_bytes{application=\"$application\", instance=\"$instance\"})",
"format": "time_series",
"intervalFactor": 2,
"legendFormat": "used",
"metric": "",
"refId": "A",
"step": 2400
},
{
"datasource": {
"type": "prometheus",
"uid": "uGg36Jg4z"
},
"expr": "sum(jvm_memory_committed_bytes{application=\"$application\", instance=\"$instance\"})",
"format": "time_series",
"intervalFactor": 2,
"legendFormat": "committed",
"refId": "B",
"step": 2400
},
{
"datasource": {
"type": "prometheus",
"uid": "uGg36Jg4z"
},
"expr": "sum(jvm_memory_max_bytes{application=\"$application\", instance=\"$instance\"})",
"format": "time_series",
"intervalFactor": 2,
"legendFormat": "max",
"refId": "C",
"step": 2400
}
],
"thresholds": [],
"timeRegions": [],
"title": "JVM Total",
"tooltip": {
"msResolution": false,
"shared": true,
"sort": 0,
"value_type": "cumulative"
},
"type": "graph",
"x-axis": true,
"xaxis": {
"mode": "time",
"show": true,
"values": []
},
"y-axis": true,
"y_formats": [
"mbytes",
"short"
],
"yaxes": [
{
"format": "bytes",
"label": "",
"logBase": 1,
"min": 0,
"show": true
},
{
"format": "short",
"logBase": 1,
"show": true
}
],
"yaxis": {
"align": false
}
},
{
"aliasColors": {},
"bars": false,
"dashLength": 10,
"dashes": false,
"datasource": {
"type": "prometheus",
"uid": "uGg36Jg4z"
},
"editable": true,
"error": false,
"fill": 1,
"fillGradient": 0,
"grid": {
"leftLogBase": 1,
"rightLogBase": 1
},
"gridPos": {
"h": 7,
"w": 6,
"x": 18,
"y": 22
},
"hiddenSeries": false,
"id": 25,
"legend": {
"avg": false,
"current": true,
"max": true,
"min": false,
"show": true,
"total": false,
"values": true
},
"lines": true,
"linewidth": 1,
"links": [],
"nullPointMode": "null",
"options": {
"alertThreshold": true
},
"percentage": false,
"pluginVersion": "8.5.6",
"pointradius": 5,
"points": false,
"renderer": "flot",
"seriesOverrides": [],
"spaceLength": 10,
"stack": false,
"steppedLine": false,
"targets": [
{
"expr": "sum(jvm_memory_used_bytes{application=\"$application\", instance=\"$instance\", area=\"nonheap\"})",
"format": "time_series",
"interval": "",
"intervalFactor": 2,
"legendFormat": "used",
"metric": "",
"refId": "A",
"step": 2400
},
{
"expr": "sum(jvm_memory_committed_bytes{application=\"$application\", instance=\"$instance\", area=\"nonheap\"})",
"format": "time_series",
"intervalFactor": 2,
"legendFormat": "committed",
"refId": "B",
"step": 2400
},
{
"expr": "sum(jvm_memory_max_bytes{application=\"$application\", instance=\"$instance\", area=\"nonheap\"})",
"format": "time_series",
"intervalFactor": 2,
"legendFormat": "max",
"refId": "C",
"step": 2400
}
],
"thresholds": [],
"timeRegions": [],
"title": "JVM Non-Heap",
"tooltip": {
"msResolution": false,
"shared": true,
"sort": 0,
"value_type": "cumulative"
},
"type": "graph",
"x-axis": true,
"xaxis": {
"mode": "time",
"show": true,
"values": []
},
"y-axis": true,
"y_formats": [
"mbytes",
"short"
],
"yaxes": [
{
"format": "bytes",
"logBase": 1,
"min": 0,
"show": true
},
{
"format": "short",
"logBase": 1,
"show": true
}
],
"yaxis": {
"align": false
}
},
{
"collapsed": true,
"datasource": {
"type": "prometheus",
"uid": "uGg36Jg4z"
},
"gridPos": {
"h": 1,
"w": 24,
"x": 0,
"y": 29
},
"id": 128,
"panels": [
{
"aliasColors": {},
"bars": false,
"dashLength": 10,
"dashes": false,
"datasource": {
"type": "prometheus",
"uid": "uGg36Jg4z"
},
"editable": true,
"error": false,
"fill": 1,
"fillGradient": 0,
"grid": {
"leftLogBase": 1,
"rightLogBase": 1
},
"gridPos": {
"h": 7,
"w": 6,
"x": 0,
"y": 22
},
"hiddenSeries": false,
"id": 106,
"legend": {
"avg": false,
"current": true,
"max": true,
"min": false,
"show": true,
"total": false,
"values": true
},
"lines": true,
"linewidth": 1,
"links": [],
"nullPointMode": "null",
"options": {
"alertThreshold": true
},
"percentage": false,
"pluginVersion": "8.5.6",
"pointradius": 5,
"points": false,
"renderer": "flot",
"seriesOverrides": [],
"spaceLength": 10,
"stack": false,
"steppedLine": false,
"targets": [
{
"expr": "system_cpu_usage{application=\"$application\", instance=\"$instance\"}",
"format": "time_series",
"hide": false,
"intervalFactor": 1,
"legendFormat": "system",
"metric": "",
"refId": "A",
"step": 2400
},
{
"expr": "process_cpu_usage{application=\"$application\", instance=\"$instance\"}",
"format": "time_series",
"hide": false,
"intervalFactor": 1,
"legendFormat": "process",
"refId": "B"
},
{
"expr": "avg_over_time(process_cpu_usage{application=\"$application\", instance=\"$instance\"}[1h])",
"format": "time_series",
"hide": false,
"intervalFactor": 1,
"legendFormat": "process-1h",
"refId": "C"
}
],
"thresholds": [],
"timeRegions": [],
"title": "CPU Usage",
"tooltip": {
"msResolution": false,
"shared": true,
"sort": 0,
"value_type": "cumulative"
},
"type": "graph",
"x-axis": true,
"xaxis": {
"mode": "time",
"show": true,
"values": []
},
"y-axis": true,
"y_formats": [
"short",
"short"
],
"yaxes": [
{
"decimals": 1,
"format": "percentunit",
"label": "",
"logBase": 1,
"max": "1",
"min": 0,
"show": true
},
{
"format": "short",
"logBase": 1,
"show": true
}
],
"yaxis": {
"align": false
}
},
{
"aliasColors": {},
"bars": false,
"dashLength": 10,
"dashes": false,
"datasource": {
"type": "prometheus",
"uid": "uGg36Jg4z"
},
"editable": true,
"error": false,
"fill": 1,
"fillGradient": 0,
"grid": {
"leftLogBase": 1,
"rightLogBase": 1
},
"gridPos": {
"h": 7,
"w": 6,
"x": 6,
"y": 22
},
"hiddenSeries": false,
"id": 93,
"legend": {
"avg": false,
"current": true,
"max": true,
"min": false,
"show": true,
"total": false,
"values": true
},
"lines": true,
"linewidth": 1,
"links": [],
"nullPointMode": "null",
"options": {
"alertThreshold": true
},
"percentage": false,
"pluginVersion": "8.5.6",
"pointradius": 5,
"points": false,
"renderer": "flot",
"seriesOverrides": [],
"spaceLength": 10,
"stack": false,
"steppedLine": false,
"targets": [
{
"expr": "system_load_average_1m{application=\"$application\", instance=\"$instance\"}",
"format": "time_series",
"intervalFactor": 2,
"legendFormat": "system-1m",
"metric": "",
"refId": "A",
"step": 2400
},
{
"expr": "system_cpu_count{application=\"$application\", instance=\"$instance\"}",
"format": "time_series",
"intervalFactor": 2,
"legendFormat": "cpus",
"refId": "B"
}
],
"thresholds": [],
"timeRegions": [],
"title": "Load",
"tooltip": {
"msResolution": false,
"shared": true,
"sort": 0,
"value_type": "cumulative"
},
"type": "graph",
"x-axis": true,
"xaxis": {
"mode": "time",
"show": true,
"values": []
},
"y-axis": true,
"y_formats": [
"short",
"short"
],
"yaxes": [
{
"decimals": 1,
"format": "short",
"label": "",
"logBase": 1,
"min": 0,
"show": true
},
{
"format": "short",
"logBase": 1,
"show": true
}
],
"yaxis": {
"align": false
}
},
{
"aliasColors": {},
"bars": false,
"dashLength": 10,
"dashes": false,
"datasource": {
"type": "prometheus",
"uid": "uGg36Jg4z"
},
"editable": true,
"error": false,
"fill": 1,
"fillGradient": 0,
"grid": {
"leftLogBase": 1,
"rightLogBase": 1
},
"gridPos": {
"h": 7,
"w": 6,
"x": 12,
"y": 22
},
"hiddenSeries": false,
"id": 32,
"legend": {
"avg": false,
"current": true,
"max": true,
"min": false,
"show": true,
"total": false,
"values": true
},
"lines": true,
"linewidth": 1,
"links": [],
"nullPointMode": "null",
"options": {
"alertThreshold": true
},
"percentage": false,
"pluginVersion": "8.5.6",
"pointradius": 5,
"points": false,
"renderer": "flot",
"seriesOverrides": [],
"spaceLength": 10,
"stack": false,
"steppedLine": false,
"targets": [
{
"expr": "jvm_threads_live_threads{application=\"$application\", instance=\"$instance\"}",
"format": "time_series",
"intervalFactor": 2,
"legendFormat": "live",
"metric": "",
"refId": "A",
"step": 2400
},
{
"expr": "jvm_threads_daemon_threads{application=\"$application\", instance=\"$instance\"}",
"format": "time_series",
"intervalFactor": 2,
"legendFormat": "daemon",
"metric": "",
"refId": "B",
"step": 2400
},
{
"expr": "jvm_threads_peak_threads{application=\"$application\", instance=\"$instance\"}",
"format": "time_series",
"intervalFactor": 2,
"legendFormat": "peak",
"refId": "C",
"step": 2400
},
{
"expr": "process_threads{application=\"$application\", instance=\"$instance\"}",
"format": "time_series",
"interval": "",
"intervalFactor": 2,
"legendFormat": "process",
"refId": "D",
"step": 2400
}
],
"thresholds": [],
"timeRegions": [],
"title": "Threads",
"tooltip": {
"msResolution": false,
"shared": true,
"sort": 0,
"value_type": "cumulative"
},
"type": "graph",
"x-axis": true,
"xaxis": {
"mode": "time",
"show": true,
"values": []
},
"y-axis": true,
"y_formats": [
"short",
"short"
],
"yaxes": [
{
"decimals": 0,
"format": "short",
"logBase": 1,
"min": 0,
"show": true
},
{
"format": "short",
"logBase": 1,
"show": true
}
],
"yaxis": {
"align": false
}
},
{
"aliasColors": {},
"bars": false,
"dashLength": 10,
"dashes": false,
"datasource": {
"type": "prometheus",
"uid": "uGg36Jg4z"
},
"editable": true,
"error": false,
"fill": 1,
"fillGradient": 0,
"grid": {
"leftLogBase": 1,
"rightLogBase": 1
},
"gridPos": {
"h": 7,
"w": 6,
"x": 18,
"y": 22
},
"hiddenSeries": false,
"id": 61,
"legend": {
"avg": false,
"current": true,
"max": true,
"min": false,
"show": true,
"total": false,
"values": true
},
"lines": true,
"linewidth": 1,
"links": [],
"nullPointMode": "null",
"options": {
"alertThreshold": true
},
"percentage": false,
"pluginVersion": "8.5.6",
"pointradius": 5,
"points": false,
"renderer": "flot",
"seriesOverrides": [],
"spaceLength": 10,
"stack": false,
"steppedLine": false,
"targets": [
{
"expr": "process_files_open_files{application=\"$application\", instance=\"$instance\"}",
"format": "time_series",
"hide": false,
"intervalFactor": 2,
"legendFormat": "open",
"metric": "",
"refId": "A",
"step": 2400
},
{
"expr": "process_files_max_files{application=\"$application\", instance=\"$instance\"}",
"format": "time_series",
"hide": false,
"intervalFactor": 2,
"legendFormat": "max",
"metric": "",
"refId": "B",
"step": 2400
}
],
"thresholds": [],
"timeRegions": [],
"title": "File Descriptors",
"tooltip": {
"msResolution": false,
"shared": true,
"sort": 0,
"value_type": "cumulative"
},
"type": "graph",
"x-axis": true,
"xaxis": {
"mode": "time",
"show": true,
"values": []
},
"y-axis": true,
"y_formats": [
"short",
"short"
],
"yaxes": [
{
"decimals": 0,
"format": "short",
"logBase": 10,
"min": 0,
"show": true
},
{
"format": "short",
"logBase": 1,
"show": true
}
],
"yaxis": {
"align": false
}
}
],
"title": "JVM Misc",
"type": "row"
},
{
"collapsed": true,
"datasource": {
"type": "prometheus",
"uid": "uGg36Jg4z"
},
"gridPos": {
"h": 1,
"w": 24,
"x": 0,
"y": 30
},
"id": 129,
"panels": [
{
"aliasColors": {},
"bars": false,
"dashLength": 10,
"dashes": false,
"datasource": {
"type": "prometheus",
"uid": "uGg36Jg4z"
},
"editable": true,
"error": false,
"fill": 1,
"fillGradient": 0,
"grid": {
"leftLogBase": 1,
"rightLogBase": 1
},
"gridPos": {
"h": 7,
"w": 8,
"x": 0,
"y": 24
},
"hiddenSeries": false,
"id": 3,
"legend": {
"alignAsTable": false,
"avg": false,
"current": true,
"max": true,
"min": false,
"rightSide": false,
"show": true,
"total": false,
"values": true
},
"lines": true,
"linewidth": 1,
"links": [],
"maxPerRow": 3,
"nullPointMode": "null",
"options": {
"alertThreshold": true
},
"percentage": false,
"pluginVersion": "8.5.6",
"pointradius": 5,
"points": false,
"renderer": "flot",
"repeat": "jvm_memory_pool_heap",
"seriesOverrides": [],
"spaceLength": 10,
"stack": false,
"steppedLine": false,
"targets": [
{
"expr": "jvm_memory_used_bytes{application=\"$application\", instance=\"$instance\", id=~\"$jvm_memory_pool_heap\"}",
"format": "time_series",
"hide": false,
"interval": "",
"intervalFactor": 2,
"legendFormat": "used",
"metric": "",
"refId": "A",
"step": 1800
},
{
"expr": "jvm_memory_committed_bytes{application=\"$application\", instance=\"$instance\", id=~\"$jvm_memory_pool_heap\"}",
"format": "time_series",
"hide": false,
"interval": "",
"intervalFactor": 2,
"legendFormat": "commited",
"metric": "",
"refId": "B",
"step": 1800
},
{
"expr": "jvm_memory_max_bytes{application=\"$application\", instance=\"$instance\", id=~\"$jvm_memory_pool_heap\"}",
"format": "time_series",
"hide": false,
"interval": "",
"intervalFactor": 2,
"legendFormat": "max",
"metric": "",
"refId": "C",
"step": 1800
}
],
"thresholds": [],
"timeRegions": [],
"title": "$jvm_memory_pool_heap",
"tooltip": {
"msResolution": false,
"shared": true,
"sort": 0,
"value_type": "cumulative"
},
"type": "graph",
"x-axis": true,
"xaxis": {
"mode": "time",
"show": true,
"values": []
},
"y-axis": true,
"y_formats": [
"mbytes",
"short"
],
"yaxes": [
{
"format": "bytes",
"logBase": 1,
"min": 0,
"show": true
},
{
"format": "short",
"logBase": 1,
"show": true
}
],
"yaxis": {
"align": false
}
}
],
"repeat": "persistence_counts",
"title": "JVM Memory Pools (Heap)",
"type": "row"
},
{
"collapsed": true,
"datasource": {
"type": "prometheus",
"uid": "uGg36Jg4z"
},
"gridPos": {
"h": 1,
"w": 24,
"x": 0,
"y": 31
},
"id": 130,
"panels": [
{
"aliasColors": {},
"bars": false,
"dashLength": 10,
"dashes": false,
"datasource": {
"type": "prometheus",
"uid": "uGg36Jg4z"
},
"editable": true,
"error": false,
"fill": 1,
"fillGradient": 0,
"grid": {
"leftLogBase": 1,
"rightLogBase": 1
},
"gridPos": {
"h": 7,
"w": 8,
"x": 0,
"y": 25
},
"hiddenSeries": false,
"id": 78,
"legend": {
"alignAsTable": false,
"avg": false,
"current": true,
"max": true,
"min": false,
"rightSide": false,
"show": true,
"total": false,
"values": true
},
"lines": true,
"linewidth": 1,
"links": [],
"maxPerRow": 3,
"nullPointMode": "null",
"options": {
"alertThreshold": true
},
"percentage": false,
"pluginVersion": "8.5.6",
"pointradius": 5,
"points": false,
"renderer": "flot",
"repeat": "jvm_memory_pool_nonheap",
"seriesOverrides": [],
"spaceLength": 10,
"stack": false,
"steppedLine": false,
"targets": [
{
"expr": "jvm_memory_used_bytes{application=\"$application\", instance=\"$instance\", id=~\"$jvm_memory_pool_nonheap\"}",
"format": "time_series",
"hide": false,
"interval": "",
"intervalFactor": 2,
"legendFormat": "used",
"metric": "",
"refId": "A",
"step": 1800
},
{
"expr": "jvm_memory_committed_bytes{application=\"$application\", instance=\"$instance\", id=~\"$jvm_memory_pool_nonheap\"}",
"format": "time_series",
"hide": false,
"interval": "",
"intervalFactor": 2,
"legendFormat": "commited",
"metric": "",
"refId": "B",
"step": 1800
},
{
"expr": "jvm_memory_max_bytes{application=\"$application\", instance=\"$instance\", id=~\"$jvm_memory_pool_nonheap\"}",
"format": "time_series",
"hide": false,
"interval": "",
"intervalFactor": 2,
"legendFormat": "max",
"metric": "",
"refId": "C",
"step": 1800
}
],
"thresholds": [],
"timeRegions": [],
"title": "$jvm_memory_pool_nonheap",
"tooltip": {
"msResolution": false,
"shared": true,
"sort": 0,
"value_type": "cumulative"
},
"type": "graph",
"x-axis": true,
"xaxis": {
"mode": "time",
"show": true,
"values": []
},
"y-axis": true,
"y_formats": [
"mbytes",
"short"
],
"yaxes": [
{
"format": "bytes",
"logBase": 1,
"min": 0,
"show": true
},
{
"format": "short",
"logBase": 1,
"show": true
}
],
"yaxis": {
"align": false
}
}
],
"title": "JVM Memory Pools (Non-Heap)",
"type": "row"
},
{
"collapsed": true,
"datasource": {
"type": "prometheus",
"uid": "uGg36Jg4z"
},
"gridPos": {
"h": 1,
"w": 24,
"x": 0,
"y": 32
},
"id": 131,
"panels": [
{
"aliasColors": {},
"bars": false,
"dashLength": 10,
"dashes": false,
"datasource": {
"type": "prometheus",
"uid": "uGg36Jg4z"
},
"fill": 1,
"fillGradient": 0,
"gridPos": {
"h": 7,
"w": 8,
"x": 0,
"y": 26
},
"hiddenSeries": false,
"id": 98,
"legend": {
"avg": false,
"current": false,
"max": false,
"min": false,
"show": true,
"total": false,
"values": false
},
"lines": true,
"linewidth": 1,
"links": [],
"nullPointMode": "null",
"options": {
"alertThreshold": true
},
"percentage": false,
"pluginVersion": "8.5.6",
"pointradius": 5,
"points": false,
"renderer": "flot",
"seriesOverrides": [],
"spaceLength": 10,
"stack": false,
"steppedLine": false,
"targets": [
{
"expr": "rate(jvm_gc_pause_seconds_count{application=\"$application\", instance=\"$instance\"}[1m])",
"format": "time_series",
"hide": false,
"intervalFactor": 1,
"legendFormat": "{{action}} ({{cause}})",
"refId": "A"
}
],
"thresholds": [],
"timeRegions": [],
"title": "Collections",
"tooltip": {
"shared": true,
"sort": 0,
"value_type": "individual"
},
"type": "graph",
"xaxis": {
"mode": "time",
"show": true,
"values": []
},
"yaxes": [
{
"format": "ops",
"logBase": 1,
"min": "0",
"show": true
},
{
"format": "short",
"label": "",
"logBase": 1,
"show": true
}
],
"yaxis": {
"align": false
}
},
{
"aliasColors": {},
"bars": false,
"dashLength": 10,
"dashes": false,
"datasource": {
"type": "prometheus",
"uid": "uGg36Jg4z"
},
"fill": 1,
"fillGradient": 0,
"gridPos": {
"h": 7,
"w": 8,
"x": 8,
"y": 26
},
"hiddenSeries": false,
"id": 101,
"legend": {
"avg": false,
"current": false,
"max": false,
"min": false,
"show": true,
"total": false,
"values": false
},
"lines": true,
"linewidth": 1,
"links": [],
"nullPointMode": "null",
"options": {
"alertThreshold": true
},
"percentage": false,
"pluginVersion": "8.5.6",
"pointradius": 5,
"points": false,
"renderer": "flot",
"seriesOverrides": [],
"spaceLength": 10,
"stack": false,
"steppedLine": false,
"targets": [
{
"expr": "rate(jvm_gc_pause_seconds_sum{application=\"$application\", instance=\"$instance\"}[1m])/rate(jvm_gc_pause_seconds_count{application=\"$application\", instance=\"$instance\"}[1m])",
"format": "time_series",
"hide": false,
"instant": false,
"intervalFactor": 1,
"legendFormat": "avg {{action}} ({{cause}})",
"refId": "A"
},
{
"expr": "jvm_gc_pause_seconds_max{application=\"$application\", instance=\"$instance\"}",
"format": "time_series",
"hide": false,
"instant": false,
"intervalFactor": 1,
"legendFormat": "max {{action}} ({{cause}})",
"refId": "B"
}
],
"thresholds": [],
"timeRegions": [],
"title": "Pause Durations",
"tooltip": {
"shared": true,
"sort": 0,
"value_type": "individual"
},
"type": "graph",
"xaxis": {
"mode": "time",
"show": true,
"values": []
},
"yaxes": [
{
"format": "s",
"logBase": 1,
"min": "0",
"show": true
},
{
"format": "short",
"label": "",
"logBase": 1,
"show": true
}
],
"yaxis": {
"align": false
}
},
{
"aliasColors": {},
"bars": false,
"dashLength": 10,
"dashes": false,
"datasource": {
"type": "prometheus",
"uid": "uGg36Jg4z"
},
"fill": 1,
"fillGradient": 0,
"gridPos": {
"h": 7,
"w": 8,
"x": 16,
"y": 26
},
"hiddenSeries": false,
"id": 99,
"legend": {
"avg": false,
"current": false,
"max": false,
"min": false,
"show": true,
"total": false,
"values": false
},
"lines": true,
"linewidth": 1,
"links": [],
"nullPointMode": "null",
"options": {
"alertThreshold": true
},
"percentage": false,
"pluginVersion": "8.5.6",
"pointradius": 5,
"points": false,
"renderer": "flot",
"seriesOverrides": [],
"spaceLength": 10,
"stack": false,
"steppedLine": false,
"targets": [
{
"expr": "rate(jvm_gc_memory_allocated_bytes_total{application=\"$application\", instance=\"$instance\"}[1m])",
"format": "time_series",
"interval": "",
"intervalFactor": 1,
"legendFormat": "allocated",
"refId": "A"
},
{
"expr": "rate(jvm_gc_memory_promoted_bytes_total{application=\"$application\", instance=\"$instance\"}[1m])",
"format": "time_series",
"interval": "",
"intervalFactor": 1,
"legendFormat": "promoted",
"refId": "B"
}
],
"thresholds": [],
"timeRegions": [],
"title": "Allocated/Promoted",
"tooltip": {
"shared": true,
"sort": 0,
"value_type": "individual"
},
"type": "graph",
"xaxis": {
"mode": "time",
"show": true,
"values": []
},
"yaxes": [
{
"format": "Bps",
"logBase": 1,
"min": "0",
"show": true
},
{
"format": "short",
"logBase": 1,
"show": true
}
],
"yaxis": {
"align": false
}
}
],
"title": "Garbage Collection",
"type": "row"
},
{
"collapsed": true,
"datasource": {
"type": "prometheus",
"uid": "uGg36Jg4z"
},
"gridPos": {
"h": 1,
"w": 24,
"x": 0,
"y": 33
},
"id": 132,
"panels": [
{
"aliasColors": {},
"bars": false,
"dashLength": 10,
"dashes": false,
"datasource": {
"type": "prometheus",
"uid": "uGg36Jg4z"
},
"editable": true,
"error": false,
"fill": 1,
"fillGradient": 0,
"grid": {
"leftLogBase": 1,
"rightLogBase": 1
},
"gridPos": {
"h": 7,
"w": 12,
"x": 0,
"y": 27
},
"hiddenSeries": false,
"id": 37,
"legend": {
"avg": false,
"current": false,
"max": false,
"min": false,
"show": true,
"total": false,
"values": false
},
"lines": true,
"linewidth": 1,
"links": [],
"nullPointMode": "null",
"options": {
"alertThreshold": true
},
"percentage": false,
"pluginVersion": "8.5.6",
"pointradius": 5,
"points": false,
"renderer": "flot",
"seriesOverrides": [],
"spaceLength": 10,
"stack": false,
"steppedLine": false,
"targets": [
{
"expr": "jvm_classes_loaded_classes{application=\"$application\", instance=\"$instance\"}",
"format": "time_series",
"intervalFactor": 2,
"legendFormat": "loaded",
"metric": "",
"refId": "A",
"step": 1200
}
],
"thresholds": [],
"timeRegions": [],
"title": "Classes loaded",
"tooltip": {
"msResolution": false,
"shared": true,
"sort": 0,
"value_type": "cumulative"
},
"type": "graph",
"x-axis": true,
"xaxis": {
"mode": "time",
"show": true,
"values": []
},
"y-axis": true,
"y_formats": [
"short",
"short"
],
"yaxes": [
{
"format": "short",
"logBase": 1,
"min": 0,
"show": true
},
{
"format": "short",
"logBase": 1,
"show": true
}
],
"yaxis": {
"align": false
}
},
{
"aliasColors": {},
"bars": false,
"dashLength": 10,
"dashes": false,
"datasource": {
"type": "prometheus",
"uid": "uGg36Jg4z"
},
"editable": true,
"error": false,
"fill": 1,
"fillGradient": 0,
"grid": {
"leftLogBase": 1,
"rightLogBase": 1
},
"gridPos": {
"h": 7,
"w": 12,
"x": 12,
"y": 27
},
"hiddenSeries": false,
"id": 38,
"legend": {
"avg": false,
"current": false,
"max": false,
"min": false,
"show": true,
"total": false,
"values": false
},
"lines": true,
"linewidth": 1,
"links": [],
"nullPointMode": "null",
"options": {
"alertThreshold": true
},
"percentage": false,
"pluginVersion": "8.5.6",
"pointradius": 5,
"points": false,
"renderer": "flot",
"seriesOverrides": [],
"spaceLength": 10,
"stack": false,
"steppedLine": false,
"targets": [
{
"expr": "delta(jvm_classes_loaded_classes{application=\"$application\",instance=\"$instance\"}[1m])",
"format": "time_series",
"hide": false,
"interval": "",
"intervalFactor": 1,
"legendFormat": "delta-1m",
"metric": "",
"refId": "A",
"step": 1200
}
],
"thresholds": [],
"timeRegions": [],
"title": "Class delta",
"tooltip": {
"msResolution": false,
"shared": true,
"sort": 0,
"value_type": "cumulative"
},
"type": "graph",
"x-axis": true,
"xaxis": {
"mode": "time",
"show": true,
"values": []
},
"y-axis": true,
"y_formats": [
"ops",
"short"
],
"yaxes": [
{
"format": "short",
"label": "",
"logBase": 1,
"show": true
},
{
"format": "short",
"logBase": 1,
"show": true
}
],
"yaxis": {
"align": false
}
}
],
"title": "Classloading",
"type": "row"
},
{
"collapsed": true,
"datasource": {
"type": "prometheus",
"uid": "uGg36Jg4z"
},
"gridPos": {
"h": 1,
"w": 24,
"x": 0,
"y": 34
},
"id": 133,
"panels": [
{
"aliasColors": {},
"bars": false,
"dashLength": 10,
"dashes": false,
"datasource": {
"type": "prometheus",
"uid": "uGg36Jg4z"
},
"editable": true,
"error": false,
"fill": 1,
"fillGradient": 0,
"grid": {
"leftLogBase": 1,
"rightLogBase": 1
},
"gridPos": {
"h": 7,
"w": 6,
"x": 0,
"y": 28
},
"hiddenSeries": false,
"id": 33,
"legend": {
"avg": false,
"current": false,
"max": false,
"min": false,
"show": true,
"total": false,
"values": false
},
"lines": true,
"linewidth": 1,
"links": [],
"nullPointMode": "null",
"options": {
"alertThreshold": true
},
"percentage": false,
"pluginVersion": "8.5.6",
"pointradius": 5,
"points": false,
"renderer": "flot",
"seriesOverrides": [],
"spaceLength": 10,
"stack": false,
"steppedLine": false,
"targets": [
{
"expr": "jvm_buffer_memory_used_bytes{application=\"$application\", instance=\"$instance\", id=\"direct\"}",
"format": "time_series",
"intervalFactor": 2,
"legendFormat": "used",
"metric": "",
"refId": "A",
"step": 2400
},
{
"expr": "jvm_buffer_total_capacity_bytes{application=\"$application\", instance=\"$instance\", id=\"direct\"}",
"format": "time_series",
"intervalFactor": 2,
"legendFormat": "capacity",
"metric": "",
"refId": "B",
"step": 2400
}
],
"thresholds": [],
"timeRegions": [],
"title": "Direct Buffers",
"tooltip": {
"msResolution": false,
"shared": true,
"sort": 0,
"value_type": "cumulative"
},
"type": "graph",
"x-axis": true,
"xaxis": {
"mode": "time",
"show": true,
"values": []
},
"y-axis": true,
"y_formats": [
"short",
"short"
],
"yaxes": [
{
"format": "bytes",
"logBase": 1,
"min": 0,
"show": true
},
{
"format": "short",
"logBase": 1,
"show": true
}
],
"yaxis": {
"align": false
}
},
{
"aliasColors": {},
"bars": false,
"dashLength": 10,
"dashes": false,
"datasource": {
"type": "prometheus",
"uid": "uGg36Jg4z"
},
"editable": true,
"error": false,
"fill": 1,
"fillGradient": 0,
"grid": {
"leftLogBase": 1,
"rightLogBase": 1
},
"gridPos": {
"h": 7,
"w": 6,
"x": 6,
"y": 28
},
"hiddenSeries": false,
"id": 83,
"legend": {
"avg": false,
"current": false,
"max": false,
"min": false,
"show": true,
"total": false,
"values": false
},
"lines": true,
"linewidth": 1,
"links": [],
"nullPointMode": "null",
"options": {
"alertThreshold": true
},
"percentage": false,
"pluginVersion": "8.5.6",
"pointradius": 5,
"points": false,
"renderer": "flot",
"seriesOverrides": [],
"spaceLength": 10,
"stack": false,
"steppedLine": false,
"targets": [
{
"expr": "jvm_buffer_count_buffers{application=\"$application\", instance=\"$instance\", id=\"direct\"}",
"format": "time_series",
"intervalFactor": 2,
"legendFormat": "count",
"metric": "",
"refId": "A",
"step": 2400
}
],
"thresholds": [],
"timeRegions": [],
"title": "Direct Buffers",
"tooltip": {
"msResolution": false,
"shared": true,
"sort": 0,
"value_type": "cumulative"
},
"type": "graph",
"x-axis": true,
"xaxis": {
"mode": "time",
"show": true,
"values": []
},
"y-axis": true,
"y_formats": [
"short",
"short"
],
"yaxes": [
{
"decimals": 0,
"format": "short",
"logBase": 1,
"min": 0,
"show": true
},
{
"format": "short",
"logBase": 1,
"show": true
}
],
"yaxis": {
"align": false
}
},
{
"aliasColors": {},
"bars": false,
"dashLength": 10,
"dashes": false,
"datasource": {
"type": "prometheus",
"uid": "uGg36Jg4z"
},
"editable": true,
"error": false,
"fill": 1,
"fillGradient": 0,
"grid": {
"leftLogBase": 1,
"rightLogBase": 1
},
"gridPos": {
"h": 7,
"w": 6,
"x": 12,
"y": 28
},
"hiddenSeries": false,
"id": 85,
"legend": {
"avg": false,
"current": false,
"max": false,
"min": false,
"show": true,
"total": false,
"values": false
},
"lines": true,
"linewidth": 1,
"links": [],
"nullPointMode": "null",
"options": {
"alertThreshold": true
},
"percentage": false,
"pluginVersion": "8.5.6",
"pointradius": 5,
"points": false,
"renderer": "flot",
"seriesOverrides": [],
"spaceLength": 10,
"stack": false,
"steppedLine": false,
"targets": [
{
"expr": "jvm_buffer_memory_used_bytes{application=\"$application\", instance=\"$instance\", id=\"mapped\"}",
"format": "time_series",
"intervalFactor": 2,
"legendFormat": "used",
"metric": "",
"refId": "A",
"step": 2400
},
{
"expr": "jvm_buffer_total_capacity_bytes{application=\"$application\", instance=\"$instance\", id=\"mapped\"}",
"format": "time_series",
"intervalFactor": 2,
"legendFormat": "capacity",
"metric": "",
"refId": "B",
"step": 2400
}
],
"thresholds": [],
"timeRegions": [],
"title": "Mapped Buffers",
"tooltip": {
"msResolution": false,
"shared": true,
"sort": 0,
"value_type": "cumulative"
},
"type": "graph",
"x-axis": true,
"xaxis": {
"mode": "time",
"show": true,
"values": []
},
"y-axis": true,
"y_formats": [
"short",
"short"
],
"yaxes": [
{
"format": "bytes",
"logBase": 1,
"min": 0,
"show": true
},
{
"format": "short",
"logBase": 1,
"show": true
}
],
"yaxis": {
"align": false
}
},
{
"aliasColors": {},
"bars": false,
"dashLength": 10,
"dashes": false,
"datasource": {
"type": "prometheus",
"uid": "uGg36Jg4z"
},
"editable": true,
"error": false,
"fill": 1,
"fillGradient": 0,
"grid": {
"leftLogBase": 1,
"rightLogBase": 1
},
"gridPos": {
"h": 7,
"w": 6,
"x": 18,
"y": 28
},
"hiddenSeries": false,
"id": 84,
"legend": {
"avg": false,
"current": false,
"max": false,
"min": false,
"show": true,
"total": false,
"values": false
},
"lines": true,
"linewidth": 1,
"links": [],
"nullPointMode": "null",
"options": {
"alertThreshold": true
},
"percentage": false,
"pluginVersion": "8.5.6",
"pointradius": 5,
"points": false,
"renderer": "flot",
"seriesOverrides": [],
"spaceLength": 10,
"stack": false,
"steppedLine": false,
"targets": [
{
"expr": "jvm_buffer_count_buffers{application=\"$application\", instance=\"$instance\", id=\"mapped\"}",
"format": "time_series",
"intervalFactor": 2,
"legendFormat": "count",
"metric": "",
"refId": "A",
"step": 2400
}
],
"thresholds": [],
"timeRegions": [],
"title": "Mapped Buffers",
"tooltip": {
"msResolution": false,
"shared": true,
"sort": 0,
"value_type": "cumulative"
},
"type": "graph",
"x-axis": true,
"xaxis": {
"mode": "time",
"show": true,
"values": []
},
"y-axis": true,
"y_formats": [
"short",
"short"
],
"yaxes": [
{
"decimals": 0,
"format": "short",
"logBase": 1,
"min": 0,
"show": true
},
{
"format": "short",
"logBase": 1,
"show": true
}
],
"yaxis": {
"align": false
}
}
],
"title": "Buffer Pools",
"type": "row"
}
],
"refresh": "5s",
"schemaVersion": 36,
"style": "dark",
"tags": [],
"templating": {
"list": [
{
"current": {
"selected": false,
"text": "auth-service",
"value": "auth-service"
},
"datasource": {
"type": "prometheus",
"uid": "uGg36Jg4z"
},
"definition": "",
"hide": 0,
"includeAll": false,
"label": "Application",
"multi": false,
"name": "application",
"options": [],
"query": {
"query": "label_values(application)",
"refId": "prod-prometheus-application-Variable-Query"
},
"refresh": 2,
"regex": "",
"skipUrlSync": false,
"sort": 0,
"tagValuesQuery": "",
"tagsQuery": "",
"type": "query",
"useTags": false
},
{
"allFormat": "glob",
"current": {
"selected": false,
"text": "192.168.180.30:30081",
"value": "192.168.180.30:30081"
},
"datasource": {
"type": "prometheus",
"uid": "uGg36Jg4z"
},
"definition": "",
"hide": 0,
"includeAll": false,
"label": "Instance",
"multi": false,
"multiFormat": "glob",
"name": "instance",
"options": [],
"query": {
"query": "label_values(jvm_memory_used_bytes{application=\"$application\"}, instance)",
"refId": "prod-prometheus-instance-Variable-Query"
},
"refresh": 2,
"regex": "",
"skipUrlSync": false,
"sort": 0,
"tagValuesQuery": "",
"tagsQuery": "",
"type": "query",
"useTags": false
},
{
"allFormat": "glob",
"current": {
"selected": false,
"text": "All",
"value": "$__all"
},
"datasource": {
"type": "prometheus",
"uid": "uGg36Jg4z"
},
"definition": "",
"hide": 0,
"includeAll": true,
"label": "JVM Memory Pools Heap",
"multi": false,
"multiFormat": "glob",
"name": "jvm_memory_pool_heap",
"options": [],
"query": {
"query": "label_values(jvm_memory_used_bytes{application=\"$application\", instance=\"$instance\", area=\"heap\"},id)",
"refId": "prod-prometheus-jvm_memory_pool_heap-Variable-Query"
},
"refresh": 1,
"regex": "",
"skipUrlSync": false,
"sort": 1,
"tagValuesQuery": "",
"tagsQuery": "",
"type": "query",
"useTags": false
},
{
"allFormat": "glob",
"current": {
"selected": false,
"text": "All",
"value": "$__all"
},
"datasource": {
"type": "prometheus",
"uid": "uGg36Jg4z"
},
"definition": "",
"hide": 0,
"includeAll": true,
"label": "JVM Memory Pools Non-Heap",
"multi": false,
"multiFormat": "glob",
"name": "jvm_memory_pool_nonheap",
"options": [],
"query": {
"query": "label_values(jvm_memory_used_bytes{application=\"$application\", instance=\"$instance\", area=\"nonheap\"},id)",
"refId": "prod-prometheus-jvm_memory_pool_nonheap-Variable-Query"
},
"refresh": 1,
"regex": "",
"skipUrlSync": false,
"sort": 2,
"tagValuesQuery": "",
"tagsQuery": "",
"type": "query",
"useTags": false
}
]
},
"time": {
"from": "now-24h",
"to": "now"
},
"timepicker": {
"now": true,
"refresh_intervals": [
"5s",
"10s",
"30s",
"1m",
"5m",
"15m",
"30m",
"1h",
"2h",
"1d"
],
"time_options": [
"5m",
"15m",
"1h",
"6h",
"12h",
"24h",
"2d",
"7d",
"30d"
]
},
"timezone": "browser",
"title": "统一认证 监控 ",
"uid": "QjiiRxRVk",
"version": 21,
"weekStart": ""
}