matlab信号处理小波变换
% 定义信号信息
fs=2^6;    %采样频率
dt=1/fs;    %采样间隔
timestart=-8;
timeend=8;
t=(0:(timeend-timestart)/dt-1)*dt+timestart;
L=length(t);
z=4*sin(2*pi*linspace(6,12,L).*t);%为待变换信号
%matlab自带的小波变换
figure(1)
[wt,f,coi] = cwt(z,'amor',fs);
pcolor(t,f,abs(wt));shading interp
clc
clear all
close all
data12_20=csvread('E:\experiment\5-5\12-1.csv',22,0);
t12=data12_20(:,1);
y12_20=data12_20(:,2);
z12_20=data12_20(:,3);
dt=data12_20(2,1)-data12_20(1,1); %采样间隔
fs=1/dt; %采样频率
L=length(t12);
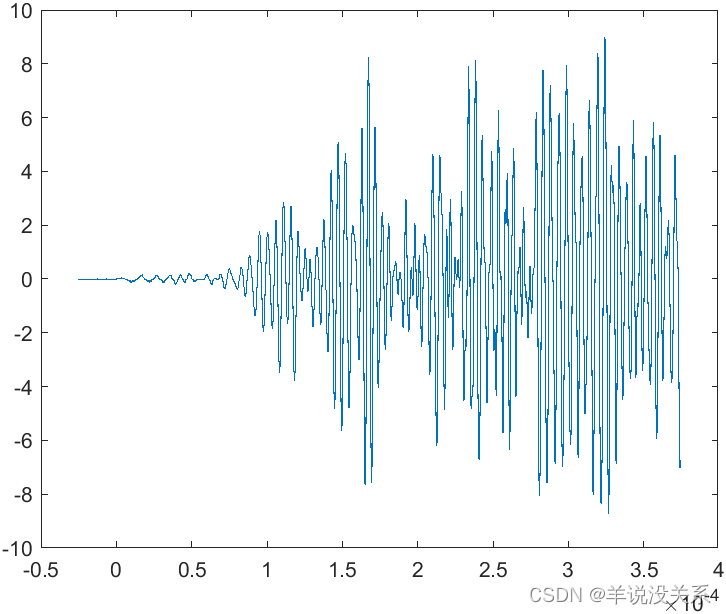
figure
plot(t12, z12_20)
%方法一
wavename='cmor3-3';
totalscal=256;
Fc=centfrq(wavename); % 小波的中心频率
c=2*Fc*totalscal;
scals=c./(1:totalscal);
f=scal2frq(scals,wavename,1/fs); % 将尺度转换为频率
coefs=cwt(z12_20,scals,wavename); % 求连续小波系数
figure
imagesc(t12,f,abs(coefs));
set(gca,'YDir','normal')
colorbar;
xlabel('时间 t/s');
ylabel('频率 f/Hz');
title('方法一');
ylim([0,1e6]);
%方法二
figure(1)
[wt,f,coi] = cwt(z12_20,'amor',fs);
pcolor(t12,f,abs(wt));shading interp
ylim([0,1e6]);
title('方法二');
%方法三
[coefs_healthy,frequencies] = cwt(z12_20,1:256,'morl',dt);
figure
surf(t12,frequencies,abs(coefs_healthy))
shading flat
colormap('jet')
view([0,0,1])
ylim([0,1e6]);
title('方法三');

fls的代码
clc
clear all
% close all

data12_1=csvread('.\5-6-2\12-1.csv',22,0);
t12_1=data12_1(:,1);
y12_1=data12_1(:,2);

data12_2=csvread('.\5-6-2\12-2.csv',22,0);
t12_2=data12_2(:,1);
y12_2=data12_2(:,2);

data34_1=csvread('.\5-6-2\34-1.csv',22,0);
y34_1=data12_1(:,2);

data12_2=csvread('.\5-6-2\34-2.csv',22,0);
y34_2=data12_2(:,2);


dt=data12_1(2,1)-data12_1(1,1);    %閲囨牱闂撮殧
fs=1/dt;   %閲囨牱棰戠巼
% figure
% plot(t12_1, y12_1)


[coefs_1,frequencies] = cwt(y12_1,4:4:1024,'morl',dt);
[coefs_2,~] = cwt(y12_2,4:4:1024,'morl',dt);
[coefs_3,~] = cwt(y34_1,4:4:1024,'morl',dt);
[coefs_4,~] = cwt(y34_2,4:4:1024,'morl',dt);

coefs_1h =zeros(256,9999);
coefs_2h =zeros(256,9999);
coefs_3h =zeros(256,9999);
coefs_4h =zeros(256,9999);
for i=1:256
    coefs_1h(i,:) = abs(hilbert(coefs_1(i,:)));
    coefs_2h(i,:) = abs(hilbert(coefs_2(i,:)));
    coefs_3h(i,:) = abs(hilbert(coefs_3(i,:)));
    coefs_4h(i,:) = abs(hilbert(coefs_4(i,:)));
end

aa=abs(coefs_1h-coefs_2h)./max(max(coefs_1h));
bb=abs(coefs_3h-coefs_4h)./max(max(coefs_3h));
figure
% subplot(2,1,1)
% surf(t12_1,frequencies,abs(coefs_1h-coefs_2h))
surf(t12_1,frequencies,coefs_1h)
shading interp;
view([0,0,1])
ylim([0,1e6]);
%
% subplot(2,1,2)
% % surf(t12_1,frequencies,abs(coefs_3h-coefs_4h))
% surf(t12_1,frequencies,bb)
% shading interp;
% view([0,0,1])
% ylim([0,1e6]);


% figure
% subplot(3,1,1)
% surf(t12_1,frequencies,abs(coefs_1))
% shading interp;
% %shading flat
% %colormap('jet')
% view([0,0,1])
% ylim([0,1e6]);
% % title('12缁勫皬娉㈠彉鎹 );
% %set(gca,'CLim',[a,b])
% % colorbar;caxis(temp1);
% subplot(3,1,2)
% surf(t12_1,frequencies,abs(coefs_2))
% shading interp;
% %shading flat
% %colormap('jet')
% view([0,0,1])
% ylim([0,1e6]);
% subplot(3,1,3)
% surf(t12_1,frequencies,abs(coefs_1-coefs_2))
% shading interp;
% %shading flat
% %colormap('jet')
% view([0,0,1])
% ylim([0,1e6]);
参考文章
参考文章