【ML】numpy meshgrid函数使用说明(全网最简单版)
【ML】numpy meshgrid函数使用说明
- meshgrid的作用?
- 怎么使用(举例说明)
- 手工描点(帮助理解)
- 怎么画三维?
- 附画图代码
meshgrid的作用?
首先要明白numpy.meshgrid()函数是为了画网格,(对就是画格子,至于格子怎么用,那要看实际场景了,我们这里只关心怎么画格子)
怎么使用(举例说明)
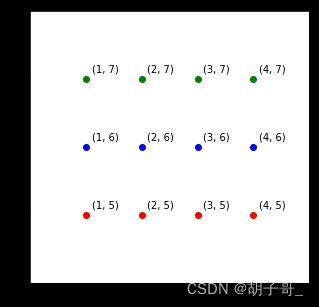
为了方便大家理解,我以结果反推的方式进行讲解,这样更直观。先看下图:
假如我们要得到这样一个网格图(注意坐标):

手工描点(帮助理解)
- 先找到坐标x=1,然后分别画出(1,5),(1,6),(1,7)
- 再找到坐标x=2,然后分别画出(2,5),(2,6),(2,7)
- 以此类推即可
我们可以得到:x=[1,2,3,4],y=[5,6,7]
做个笛卡尔积即可得到所有点。所以我们可以有以下代码:
x_component = np.array([1,2,3,4])
y_component = np.array([5,6,7])
x,y = np.meshgrid(x_component,y_component)
输出结果:
x=[[1 2 3 4]
 [1 2 3 4]
 [1 2 3 4]]
y=[[5 5 5 5]
 [6 6 6 6]
 [7 7 7 7]]
输出结果有点不好理解。这是啥???,但是我们观察规律,如果我们把x,y两个矩阵当做两张图片叠加在一起是什么效果?
示意图:
[[1 5    2 5    3 5    4 5]
 [1 6    2 6    3 6    4 6]
 [1 7    2 7    3 7    4 7]]
然后上下翻转一下:
[[1 7    2 7    3 7    4 7]
 [1 6    2 6    3 6    4 6]
 [1 5    2 5    3 5    4 5]]
这不是跟图上的坐标一模一样嘛!!!
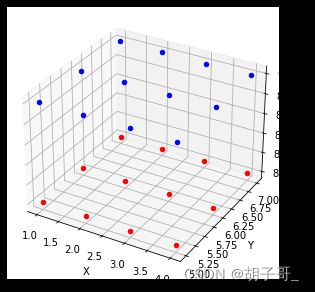
怎么画三维?
x_component = np.array([1,2,3,4])
y_component = np.array([5,6,7])
z_component = np.array([8,9])
x,y,z = np.meshgrid(x_component,y_component,z_component)
输出(怎么理解?叠加法!!!):
x= [[[1 1]
  [2 2]
  [3 3]
  [4 4]]

 [[1 1]
  [2 2]
  [3 3]
  [4 4]]

 [[1 1]
  [2 2]
  [3 3]
  [4 4]]]
y= [[[5 5]
  [5 5]
  [5 5]
  [5 5]]

 [[6 6]
  [6 6]
  [6 6]
  [6 6]]

 [[7 7]
  [7 7]
  [7 7]
  [7 7]]]
z= [[[8 9]
  [8 9]
  [8 9]
  [8 9]]

 [[8 9]
  [8 9]
  [8 9]
  [8 9]]

 [[8 9]
  [8 9]
  [8 9]
  [8 9]]]
附画图代码
二维图:
#二维图
import numpy as np
x_component = np.array([1,2,3,4])
y_component = np.array([5,6,7])
xv,yv = np.meshgrid(x_component,y_component)

import matplotlib.pyplot as plt
str_label = '({x_label}, {y_label})'
fig = plt.figure(figsize=(5,5))
plt.axis([0,5,4,8])

xy = np.c_[xv.ravel(),yv.ravel()]
for point in xy:
    x = point[0]
    y = point[1]
    color = 'r' if y==5 else ('b' if y==6 else 'g')
    plt.scatter(x, y, c=color)
    plt.annotate(str_label.format(x_label=x,y_label=y),xy = (x, y), xytext = (x+0.1, y+0.1))

plt.show()
三维图:
# 3维图
import numpy as np
x_component = np.array([1,2,3,4])
y_component = np.array([5,6,7])
z_component = np.array([8,9])
xv,yv,zv = np.meshgrid(x_component,y_component,z_component)

import matplotlib.pyplot as plt
fig = plt.figure(figsize=(5,5))
ax = fig.add_subplot(projection='3d')
ax.set_xlabel('X')
ax.set_ylabel('Y')
ax.set_zlabel('Z')

xyz = np.c_[xv.ravel(),yv.ravel(),zv.ravel()]
for point in xyz:
    x = point[0]
    y = point[1]
    z = point[2]
    color = 'r' if z == 8 else 'b'
    ax.scatter(x, y, z, c=color)
plt.show()
