Kaggle练习赛Spaceship Tantic 数据探索(下)规律一致性分析与对抗性验证
Kaggle练习赛Spaceship Tantic 数据探索(下)规律一致性分析与对抗性验证
首先对数据进行一下简单的处理。
import pandas as pd
import seaborn as sns
import numpy as np
import matplotlib.pyplot as plt
import seaborn as sns

train = pd.read_csv('train.csv')
test = pd.read_csv('test.csv')
train['NameLength'] = train['Name'].str.len()-1
test['NameLength'] = test['Name'].str.len()-1
train[['Deck', 'Num','Side']] = train['Cabin'].str.split('/', expand=True)
test[['Deck', 'Num','Side']] = test['Cabin'].str.split('/', expand=True)
train = train.drop(['Name','Cabin'],axis = 1)
test = test.drop(['Name','Cabin'],axis = 1)

# 离散字段
category_cols = ['HomePlanet', 'CryoSleep', 'Destination', 'VIP', 'Deck', 'Side','NameLength']

# 标签
target = 'Transported'

# 连续字段
numeric_cols = ['Num','RoomService','FoodCourt','ShoppingMall','Spa','VRDeck','Age']

ID = 'PassengerId'
一.规律一致性分析
所谓规律一致性,指的是需要对训练集和测试集特征数据的分布进行简单比对,以“确定”两组数据是否诞生于同一个总体,即两组数据是否都遵循着背后总体的规律,即两组数据是否存在着规律一致性。
我们知道,尽管机器学习并不强调样本-总体的概念,但在训练集上挖掘到的规律要在测试集上起到预测效果,就必须要求这两部分数据受到相同规律的影响。一般来说,对于标签未知的测试集,我们可以通过特征的分布规律来判断两组数据是否取自同一总体。
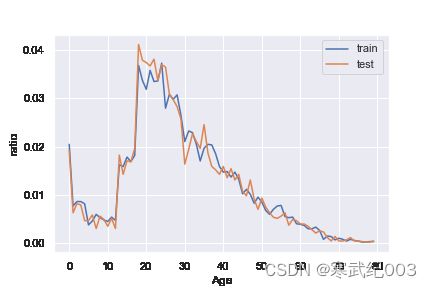
首先我们先进行简单的单变量分布规律的对比。观察年龄的分布。
train_count = train.shape[0]
test_count = test.shape[0]

sns.set()
(train['Age'].value_counts().sort_index()/train_count).plot()
(test['Age'].value_counts().sort_index()/test_count).plot()
plt.legend(['train','test'])
plt.xlabel('Age')
plt.ylabel('ratio')
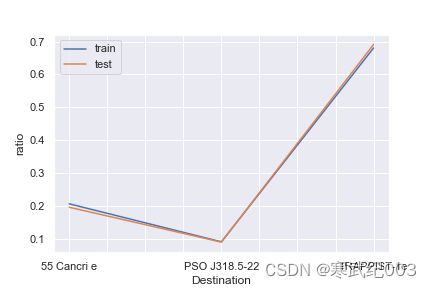
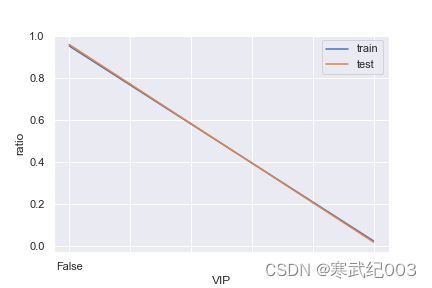
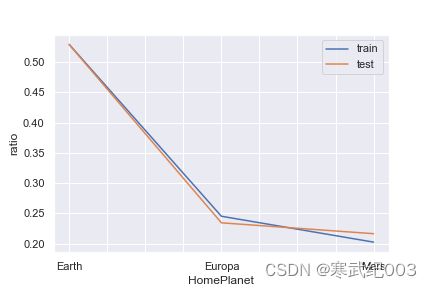
可以看出分布在测试集和训练集还是有较强一致性的。下面对离散字段全部进行检验。
sns.set()
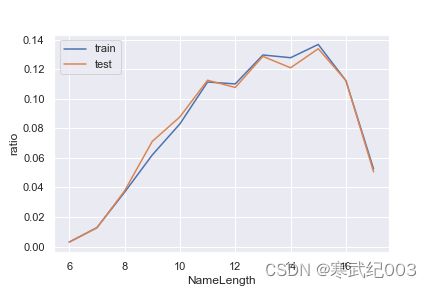
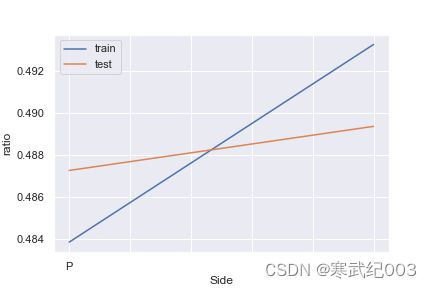
for feature in category_cols:
    (train[feature].value_counts().sort_index()/train_count).plot()
    (test[feature].value_counts().sort_index()/test_count).plot()
    plt.legend(['train','test'])
    plt.xlabel(feature)
    plt.ylabel('ratio')
    plt.show()
可以看出Side的分布有较大差异。接下来,我们进一步查看联合变量分布。所谓联合概率分布,指的是将离散变量两两组合,然后查看这个新变量的相对占比分布。例如特征1有0/1两个取值水平,特征2有A/B两个取值水平,则联合分布中就将存在0A、0B、1A、1B四种不同取值水平,然后进一步查看这四种不同取值水平出现的分布情况。
首先我们可以创建如下函数以实现两个变量“联合”的目的:
def combine_feature(df):
    cols = df.columns
    feature1 = df[cols[0]].astype(str).values.tolist()
    feature2 = df[cols[1]].astype(str).values.tolist()
    return pd.Series([feature1[i]+'&'+feature2[i] for i in range(df.shape[0])])
n = len(category_cols)
for i in range(n-1):
    for j in range(i+1, n):
        cols = [category_cols[i], category_cols[j]]
        print(cols)
        train_dis = combine_feature(train[cols]).value_counts().sort_index()/train_count
        test_dis = combine_feature(test[cols]).value_counts().sort_index()/test_count
        index_dis = pd.Series(train_dis.index.tolist() + test_dis.index.tolist()).drop_duplicates().sort_values()
        (index_dis.map(train_dis).fillna(0)).plot()
        (index_dis.map(train_dis).fillna(0)).plot()
        plt.legend(['train','test'])
        plt.xlabel('&'.join(cols))
        plt.ylabel('ratio')
        plt.show()
二.对抗性验证
在处理实际数据集时,经常会出现测试集和训练集截然不同的情况。因此,可能导致交叉验证结果不一致
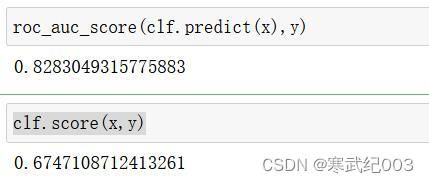
在这种情况下,可以使用对抗验证法:总体思路是根据特征分布创建一个分类模型,以检查训练集和测试集之间的相似程度。如果模型AUC在0.7以上,表示分类器表现较好,也间接说明train 和test 差异度较大。
代码参考
先对数据集进行进一步处理。
for col in numeric_cols:
    train[col]= train[col].apply(lambda x: x if x!= ' ' else np.nan).astype(float)
    test[col]= test[col].apply(lambda x: x if x!= ' ' else np.nan).astype(float)
for col in category_cols:
    train[col].fillna(train[col].mode()[0], inplace=True)#众数填充
    test[col].fillna(test[col].mode()[0], inplace=True)#众数填充
for col in numeric_cols:
    train[col].fillna(train[col].mean(), inplace=True)#均值填充
    test[col].fillna(test[col].mean(), inplace=True)#均值填充

feature_name = train.columns.to_list()
feature_name.remove(target)
feature_name.remove(ID)

train_feature = pd.get_dummies(train[feature_name])
test_feature = pd.get_dummies(test[feature_name])
接下来进行模型构建。
from sklearn.ensemble import RandomForestClassifier, AdaBoostClassifier, GradientBoostingClassifier, ExtraTreesClassifier, BaggingClassifier

创建新的目标变量:训练集为1;测试集为0
train_feature['is_train'] = 1
test_feature['is_train'] = 0

合并训练集和测试集
df = pd.concat([train_feature, test_feature], axis = 0)

使用新变量训练分类模型,并预测概率
y = df['is_train'];
x = df.drop('is_train',axis=1)
clf = AdaBoostClassifier()        #随意选取分类器即可
clf.fit(x,y)
probs = clf.predict_proba(x)[:,0]
probs = probs[:train_feature.shape[0]]
from sklearn.metrics import accuracy_score, recall_score, precision_score, f1_score, roc_auc_score

roc_auc_score(clf.predict(x),y)   #AUC
clf.score(x,y)               #准确率
#划分验证集
new_df = pd.DataFrame({'index':train.index, 'probs':probs})
new_df = new_df.sort_values(by = 'probs', ascending=False)
# 30% validation set

val_set_ids = new_df.iloc[0:np.int(new_df.shape[0]*0.3),1]
val_set_ids.to_csv('ID.csv')      #记录挑选出的验证集的index

Train = pd.read_csv('train.csv')
train_index = Train.index
train_index = train_index.to_list()
for id in Train.index:
    if id in val_set_ids.index.to_list():
        train_index.remove(id)

Train_true = Train.loc[train_index].copy()
Train_true.to_csv('train_true.csv',index=False)   #划分出的训练集
Eval = Train.loc[val_set_ids.index].copy()
Eval.to_csv('eval.csv',index=False)    #30%划分验证集,与测试集高度相似
