强化学习——格子世界
强化学习——格子世界
项目源码地址:https://gitee.com/infiniteStars/machine-learning-experiment
1. 实验内容
2. 实验代码
import numpy as np
import matplotlib.pyplot as plt
from matplotlib.table import Table
from xml.dom.minidom import Document
#手动输入格子的大小
WORLD_SIZE = int(input("请输入状态个数:"))
# 两个终点的位置(下标从0开始,下同)
A_POS = [0,0]
# 状态B的位置
B_POS = [WORLD_SIZE-1, WORLD_SIZE-1]
# 折扣因子
DISCOUNT = 0.9
# 动作集={上,下,左,右}
ACTIONS = [np.array([0, -1]),  # left
           np.array([-1, 0]),  # up
           np.array([0, 1]),   # right
           np.array([1, 0])]   # down
# 策略,每个动作等概率
ACTION_PROB = 0.25

# 将数据写进xml文件中
def write_datato_xml(data,name):
    # 实例化一个Domcument
    dom = Document()
    # 创建根节点
    paper = dom.createElement("Paper")
    # 将根节点添加到domcument中
    dom.appendChild(paper)
    # 循环遍历所有数据,写入domcument中

    # 将sortnumber 写入
    for x in range(len(data)):
        # 创建sortnumber标签
        sortnumber = dom.createElement(name)
        # 将sortnumber加入到根节点paper
        paper.appendChild(sortnumber)
        # 取出每一个数据
        x_data = data[x]
        # 创建text标签
        sortnumber_text = dom.createTextNode(x_data)
        # 将text标签加入到sortnumber标签中
        sortnumber.appendChild(sortnumber_text)
        # 添加属性
        sortnumber.setAttribute("number",'{}'.format(x))

    with open("data.xml",'w',encoding='utf-8') as f:
        # f:文件对象,indent:每个tag前面填充的字符,addindent:每个子节点的缩进字符,newl:每个tag后填充的字符
        dom.writexml(f, indent='\t', newl='\n', addindent='\t')
        f.close()

# 绘图相关函数
def draw_image(image):
    fig, ax = plt.subplots()
    ax.set_axis_off()
    tb = Table(ax, bbox=[0, 0, 1, 1])
    nrows, ncols = image.shape
    width, height = 1.0 / ncols, 1.0 / nrows
    # 添加表格
    for (i, j), val in np.ndenumerate(image):
        tb.add_cell(i, j, width, height, text=val,
                    loc='center', facecolor='white')
    # 行标签
    for i, label in enumerate(range(len(image))):
        tb.add_cell(i, -1, width, height, text=label + 1, loc='right',
                    edgecolor='none', facecolor='none')
    # 列标签
    for j, label in enumerate(range(len(image))):
        tb.add_cell(WORLD_SIZE, j, width, height / 2, text=label + 1, loc='center',
                    edgecolor='none', facecolor='none')
    ax.add_table(tb)

def step(state, action):
    """每次走一步
    :param state:当前状态,坐标的list,比如[1,1]
    :param action:当前采取的动作,是对状态坐标的修正
    :return:下一个状态(坐标的list)和reward
    """
    if state == A_POS:
        return A_POS, 0
    if state == B_POS:
        return B_POS, 0

    next_state = (np.array(state) + action).tolist()
    x, y = next_state
    # 判断是否出界
    if x < 0 or x >= WORLD_SIZE or y < 0 or y >= WORLD_SIZE:
        reward = -1.0
        next_state = state
    else:
        reward = -1.0
    return next_state, reward

# 使用iterative policy evaluation 计算每个单元格的状态价值函数
def grid_world_value_function():
    # 状态价值函数的初值
    value = np.zeros((WORLD_SIZE, WORLD_SIZE))
    episode = 0
    history = {}
    status = [];
    while True:
        episode = episode + 1
        # 每一轮迭代都会产生一个new_value,直到new_value和value很接近即收敛为止
        new_value = np.zeros_like(value)
        for i in range(WORLD_SIZE):
            for j in range(WORLD_SIZE):
                for action in ACTIONS:
                    (next_i, next_j), reward = step([i, j], action)
                    # bellman equation
                    # 由于每个方向只有一个reward和s'的组合,这里的p(s',r|s,a)=1
                    new_value[i, j] += ACTION_PROB * (reward + DISCOUNT * value[next_i, next_j])
        error = np.sum(np.abs(new_value - value))
        history[episode] = error
        if error < 1e-4:
            draw_image(np.round(new_value, decimals=2))
            plt.title('$v_{\pi}$')
            plt.show()
            plt.close()
            break
        # 观察每一轮次状态价值函数及其误差的变化情况
        value1 = f"{episode}-{np.round(error,decimals=5)}:\n{np.round(new_value,decimals=2)}";
        status.append(value1);
        # print(f"{episode}-{np.round(error,decimals=5)}:\n{np.round(new_value,decimals=2)}")
        value = new_value
    write_datato_xml(status,"grid_world_value_function")
    return history, value

# 计算格子世界的最优价值函数 (通过这个图就可以看出每个格子该往哪个方向)
def grid_world_optimal_policy():
    value = np.zeros((WORLD_SIZE, WORLD_SIZE))
    # 通过一个数组来表示每一个格子的最优动作,1表示在相应的方向上最优的
    optimal_policy = np.zeros((WORLD_SIZE, WORLD_SIZE, len(ACTIONS)))
    episode = 0
    while True:
        episode = episode + 1
        # keep iteration until convergence
        new_value = np.zeros_like(value)
        for i in range(WORLD_SIZE):
            for j in range(WORLD_SIZE):
                # 保存当前格子所有action下的state value
                action_values = []
                for action in ACTIONS:
                    (next_i, next_j), reward = step([i, j], action)
                    # value iteration
                    action_values.append(reward + DISCOUNT * value[next_i, next_j])
                new_value[i, j] = np.max(action_values)
        error = np.sum(np.abs(new_value - value))
        if error < 1e-4:
            draw_image(np.round(new_value, decimals=2))
            plt.title('$v_{*}$')
            plt.show()
            plt.close()
            break
        # 观察每一轮次状态价值函数及其误差的变化情况
        print(f"{episode}-{np.round(error,decimals=5)}:\n{np.round(new_value,decimals=2)}")
        value = new_value

def plot_his(history, title):
    # for his in history:
    #     index, error = his.keys(), his.values()
    #     plt.plot(index, error)
    index, error = history.keys(), history.values()
    plt.plot(index, error)
    plt.title(title)
    plt.xlabel("episode")
    plt.ylabel("error")
    if len(history) != 1:
        plt.legend(["grid_world_value_function", "grid_world_value_function_in_place"])
    plt.show()


if __name__ == '__main__':

    history1, _ = grid_world_value_function()
    # history2, _ = grid_world_value_function_in_place()
    # plot_his([history1, history2], "iterative policy evaluation error")
    plot_his(history1, "iterative policy evaluation error")
    grid_world_optimal_policy()
3. 实验结果
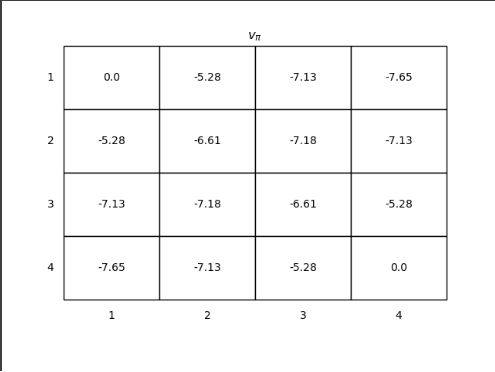
- 每个单元格的状态价值如下图所示
- 每次迭代后误差值的变化如下图所示。
- 每个单元格的最优价值如下图所示。
- 每次迭代后单元格的状态价值保存在XML文档中,部分截图如下图所示。
4. 实验分析及总结
从每个单元格最优价值表中可以看出,越靠近最终状态的单元格,其价值越大。这是因为除非到达最终状态,不然所有的状态改变的返回值都是 -1。从这个表中,也可以看出agent该往哪一个方向走,只要相邻单元格的价值大于agent所在的单元格,就可以移动。举例来说,假如agent在(1,1)处,它可以往上走,往左走,因为(0,1),(1,0)处的单元格价值都大于(1,1)处。


