银行贷款预测模型项目(Loan Prediction)(上)
项目背景
在房贷审批流程中,银行需要考虑贷款申请人的各种信息,比如家庭情况、经济情况、房子情况等等,经过综合分析这些因素后决定是否要贷款给申请人,即审批通过还是拒绝。
在大部分情况下,只需要一些基本的信息便可以大致判断申请人是否符合放贷资格。银行希望希望能够根据客户提供的详细信息(在线上填写申请表格),自动化贷款资格审批流程,并且将结果实时反馈给客户。
问题:贷款申请否通过?
这是一个生活中非常常见的二分类问题,基本上所有的银行每天都在处理这个问题,如果可以将这个过程自动化,便可一大大减少人力和时间成本。
建立假设(Hypothesis Generation)
很多项目流程都忽略了这一步,但是建立基本的假设更便于之后确定处理和分析数据资料的方向、范围。针对项目的问题:贷款申请是通过还是拒绝? 需要考虑是什么因素对贷款有影响。 这里,因变量(Y)是贷款;自变量(X)是各种对贷款有影响的因素。
这里按照我们的对于放贷的理解,作出几点假设:
1)工资:工资越高,贷款更容易通过;
2)贷款期限和金额:贷款期限越短、金额越少的越容易通过;
3)EMI:monthly incom 还贷额占月收入比例,占比越低越容易通过;
4)贷款历史:已偿清之前贷款的申请人,贷款通过的机率更大。
数据探索性分析 EDA
1. 了解数据(Understand the Data)
#导入模块包
import pandas as pd
import numpy as np                     # For mathematical calculations
import seaborn as sns                  # For data visualization
import matplotlib.pyplot as plt        # For plotting graphs
%matplotlib inline
import warnings                        # To ignore any warnings warnings.filterwarnings("ignore")

#读取数据
#Reading Data
train=pd.read_csv('train_ctrUa4K.csv')
test=pd.read_csv('test-file.csv')

#make a copy
train_original = train.copy()
test_original=test.copy()

#查看两个数据集有什么数据特征
print(train.columns)  #check the columns:Train.data has 'Loan_Status'
print(test.columns)

# Print data types for each variable train.dtypes
print(train.dtypes)

print(train.shape)
print(test.shape)  #We have 614 rows and 13 columns in the train dataset and 367 rows and 12 columns in test dataset.
训练集Train 一共有614行,13列; Test测试集是367行,12列。 其中,训练集中每一列内容如下:
| 特征名称 | 数据格式 | 特征含义 |
|---|---|---|
| Loan_ID | object | 贷款ID |
| Gender | object | 性别 |
| Married | object | 婚姻情况 |
| Dependents | object | 赡养人数 |
| Education | object | 教育情况 |
| Self_Employed | object | 是否自雇人士 |
| ApplicantIncome | int64 | 申请人收入 |
| CoapplicantIncome | float64 | 共同申请人收入 |
| LoanAmount | float64 | 贷款金额 |
| Loan_Amount_Term | float64 | 贷款期限 |
| Credit_History | float64 | 信用记录 |
| Property_Area | object | 所在区域 |
| Loan_Status | object | 贷款状况 |
2. 单变量分析(Univariate Analysis)
2.1 目标变量
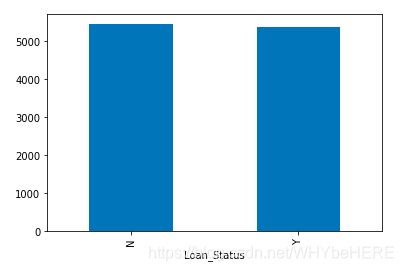
首先需要了解目标变量,贷款情况(通过还是拒绝)。由于这是个分类变量,因此分析方法采取计算频率、百分比和柱状图。
#univariate Analysis
print(train['Loan_Status'].value_counts())
# Normalize can be set to True to print proportions instead of number
print(train['Loan_Status'].value_counts(normalize=True))
train['Loan_Status'].value_counts().plot.bar()
- 422个申请人,约70%的贷款申请都是通过的。
2.2 自变量(Independent Variable)
了解完目标变量,我们接着分析其他的数据特征。
数据特征可以分成三类:分类特征、序数特征、数值特征:
关于各类数值的分析方法,可参考另一个笔记关于EDA的总结
2.2.1 分类特征 (Categorical Features)
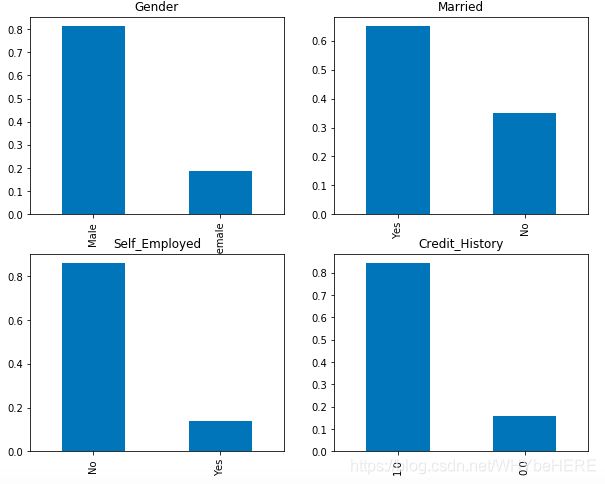
#Independent Variable (Categorical)
plt.figure(1)
plt.subplot(221)
train['Gender'].value_counts(normalize=True).plot.bar(figsize=(10,8), title= 'Gender')
plt.subplot(222)
train['Married'].value_counts(normalize=True).plot.bar(title= 'Married')
plt.subplot(223)
train['Self_Employed'].value_counts(normalize=True).plot.bar(title= 'Self_Employed')
plt.subplot(224)
train['Credit_History'].value_counts(normalize=True).plot.bar(title= 'Credit_History')
plt.show()
- 近80%的申请人是男性,
- 大约65%的申请人是已婚;
- 15%是自雇人士
- 85%的申请人有信用记录。
2.2.2 序数特征 (Ordinal features:)
序数特征是分类特征中有一定顺序/规律的特征,比如教育程度,家庭人数等,所在区域等。
#ordinary
plt.figure(1)
plt.subplot(131)
train['Dependents'].value_counts(normalize=True).plot.bar(figsize=(20,5), title= 'Dependents')
plt.subplot(132)
train['Education'].value_counts(normalize=True).plot.bar(title= 'Education')
plt.subplot(133)
train['Property_Area'].value_counts(normalize=True).plot.bar(title= 'Property_Area')
plt.show()

train['Loan_Amount_Term'].value_counts(normalize=True).plot.bar(figsize=(10,5), title= 'Loan_Amount_Term)
- 大部分的申请人赡养人数为0,即没有需要他们提供生活资金的人;
- 大约80%的申请人是大学毕业生;
- 绝大部分的申请贷款的房产位于自半城市地区;
- 80%的贷款期限都是30年,不足10%的是15年 。
2.2.3 数值特征
在案例中,有三个重要的数值型变量特征:申请人收入ApplicantIncome, 共同申请人收入CoapplicantIncome, 贷款金额LoanAmount; 可以使用直方图和箱型图分析数值特征的分布情况。
# Numerical Variable (这只列一个ApplicantIncome,另外两个(CoapplicantIncome, LoanAmount)也是一样的。
plt.figure(1)
plt.subplot(121)
sns.distplot(train['ApplicantIncome']);
plt.subplot(122)
train['ApplicantIncome'].plot.box(figsize=(16,5))
plt.show()
- 申请人收入ApplicantIncome:
从直方图可以看到整体分布是左偏的,并不符合正态分布,因此需要在后面一步中对数据做处理。
- 共同申请人收入CoapplicantIncome: 大部分共同申请的的收入在0-5000之间;和上面申请人收入的分布类似,也不是正态分布的,并且也有很多离散值。

- 贷款金额(Loan Amount): 贷款金额的分布接近于正太分布,但也有非常多的离散值。

3. 双/多变量分析(Bivariate Analysis)
回顾我们之前的假设:
- 高收入的申请人更高几率通过。
- 贷款金额越少越容易通过;
- 贷款期限越短越容易。
多变量分析方法可以根据特征的类型区分:数值特征之间、分类特征之间、分类特征和数值特征。
我们的目标是探索各种因素对目标变量(Loan_Status)的影响,在2.单变量分析里,我们了解了各类特征的基本情况,在多变量分析里,我们将这些特征和目标变量组合起来分析
3.1 分类特征&目标变量
使用堆积柱状图,直接将结果用百分比展示,查看各个分类特征对目标变量(Loan_Status)的影响。
#Target V & categorical V
Gender=pd.crosstab(train['Gender'],train['Loan_Status'])
Gender.div(Gender.sum(1).astype(float),axis=0).plot(kind='bar',stacked=True,figsize=(4,4))
- 已婚的申请人更容易获得通过;
- 赡养人数为1 或者3个以上的申请人,贷款通过率相似;
- 自雇和非自雇的申请人通过率相似;
- 有信用历史的人更容易获得贷款;
- 在半城市化区域的放贷申请,比农村和城市地区更容易通过;
- 大学毕业的申请人的通过率比没有毕业的要高。
3.2 数值特征&目标变量
对于数值型变量,最常用的分析方法是使用分类(Bin),比如将收入划分为低、中、高、超高四个类别,再画堆积图具体分析。 这里分析的数值特征有:申请人/共同申请人的收入;贷款金额
- 申请人收入
#mean
train.groupby('Loan_Status')['ApplicantIncome'].mean().plot.bar()
- 从平均数上看,贷款被拒绝和通过的申请人的平均收入一致,
- 单看平均数还不能证明申请人的收入并不影响贷款结果,需要进一步用BIN分析。
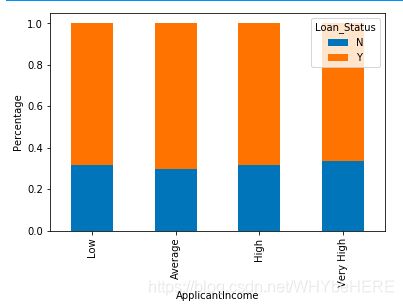
#bin
bins=[0,2500,4000,6000,81000]
group=['Low','Average','High','Very High']
train['Income_bin']=pd.cut(train['ApplicantIncome'],bins,labels=group)

Income_bin=pd.crosstab(train['Income_bin'],train['Loan_Status'])
Income_bin.div(Income_bin.sum(1).astype(float),axis=0).plot(kind='bar',stacked=True)
plt.xlabel('ApplicantIncome')
P = plt.ylabel('Percentage')

这里将收入分成了低、平均、高和非常高四类,可以发现四类的通过率都是一致的,意味着申请的收入并不影响贷款审批,这与我们之前的假设:’收入越高越容果通过‘不一致。
- 共同申请人收入(coapplicant Income )

同样的方法,将共同申请人的收入分成高中低三类。这里可以发现,共同申请人收入越低,反而更容易通过。这里与我们的经验常识不符。
这可能是因为许多申请人并没有共同申请人(共同申请人为0)所以在审批流程中,这些案例无需考虑共同申请人的收入。
因此,我们在这里引进一个新的特征(汇总收入),将申请人和共同申请人的收入加总,作为一个新的变量。
- 汇总收入(Total_Income)
# combine the Applicant Income and Coapplicant Income
#and see the combined effect of Total Income on the Loan_Status.
train['Total_Income']=train['ApplicantIncome']+train['CoapplicantIncome']

引入新特征(汇总收入)之后,我们可以看到,相比平均、高和非常高三列,第一列‘低’明显通过率更低,被拒绝的可能性接近60%。 总收入越低,贷款被拒绝的可能性越高。
- 贷款金额
使用相同的手段将贷款金额分成三组,图片展示的结果也和我们之前的假设一致,金额低的贷款更容易通过。第三列的蓝色部分(被拒绝)更高。

3.3 相关性
为了进一步比较各类特征的相关性,可以画热力图表示特征之间的相关性。由于很多模型(比如回归模型),只能处理数字,所以需要将文字类型的特征描述转换成数字:
首先,需要将有3个以上不同类别的特征,改成只有三个类别,并将转换成数值型;其次,需要把目标变量(Loan_status)的两个类别,转换成0和1。
train=train.drop(['Income_bin','Coapplicant_Income_bin','LoanAmount_bin','Total_Income_bin','Total_Income'],axis=1)

train['Dependents'].replace('3+',3,inplace=True)
test['Dependents'].replace('3+',3,inplace=True)
train['Loan_Status'].replace('N',0,inplace=True)
train['Loan_Status'].replace('Y',1,inplace=True)

#heat map
matrix=train.corr()
f, ax=plt.subplots(figsize=(9, 6))
sns.heatmap(matrix,vmax=.8,square=True,cmap='BuPu')
- 参考右边图例,颜色越深代表相关系数越接高。
- 相关性最高的变量是(申请人收入-贷款金额)和(贷款历史-贷款情况)
- 贷款金额与共同申请人的收入也具有一定的相关性
4.处理缺失值和异常值
4.1缺失值处理
- 列出所有特征缺失值个数
- 插补缺失值:
- 数值型变量特征使用中位数或者平均值
- 分类变量用众数插补 - 检查数据集是否还有缺失值
# 1. list out
print(train.isnull().sum())

性别、婚姻情况、亲属、是否自雇认识,贷款金额,贷款期限和贷款历史,这些特征都有缺失值。
# 2. fill the missing values:
train['Gender'].fillna(train['Gender'].mode()[0],inplace=True)
train['Married'].fillna(train['Married'].mode()[0],inplace=True)
train['Dependents'].fillna(train['Dependents'].mode()[0],inplace=True)
train['Self_Employed'].fillna(train['Self_Employed'].mode()[0],inplace=True)
train['Credit_History'].fillna(train['Credit_History'].mode()[0],inplace=True)

#  fill the missing values in Loan_Amount_Term
#print(train['Loan_Amount_Term'].value_counts()) #查看各种数据的次数统计
train['Loan_Amount_Term'].fillna(train['Loan_Amount_Term'].mode()[0], inplace=True)

# Numerical variable, use mean or median to impute the missing values.
train['LoanAmount'].fillna(train['LoanAmount'].median(), inplace=True)
根据每个特征的具体情况,采用不同的方法处理缺失值。
- 众数mode()
- 中位数 median()
- 平均数 mean()
# 3. check
train.isnull().sum()

#using the method to replace the test.file
test['Gender'].fillna(train['Gender'].mode()[0],inplace=True)
test['Married'].fillna(train['Married'].mode()[0],inplace=True)
test['Dependents'].fillna(train['Dependents'].mode()[0],inplace=True)
test['Self_Employed'].fillna(train['Self_Employed'].mode()[0],inplace=True)
test['Credit_History'].fillna(train['Credit_History'].mode()[0],inplace=True)
test['Loan_Amount_Term'].fillna(train['Loan_Amount_Term'].mode()[0],inplace=True)
test['LoanAmount'].fillna(train['LoanAmount'].median(),inplace=True)
最后检查是否处理完所有缺失值,同时测试集的缺失值也要用同样方法处理.

4.2 离散值处理
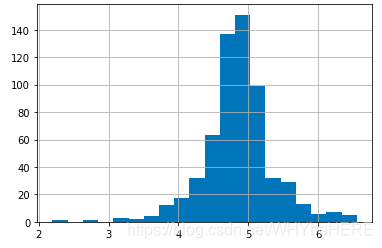
根据之前的分析,案例中的数值特征有非常大的离散值,导致整体分布偏斜。最基本的解决方法是用对数log。对数变换几乎对小的数值没什么影响,但可以将大的数值降低。经过对数变换后,就可以得到一个正态分布图。
####Outliner
train['LoanAmount_log']=np.log(train['LoanAmount'])
train['LoanAmount_log'].hist(bins=20)
test['LoanAmount_log']=np.log(test['LoanAmount'])

数据集经过分析和预处理,接下来就可以开始特征工程和建立模型。下篇链接
参考链接:Loan Prediction Practice Problem


